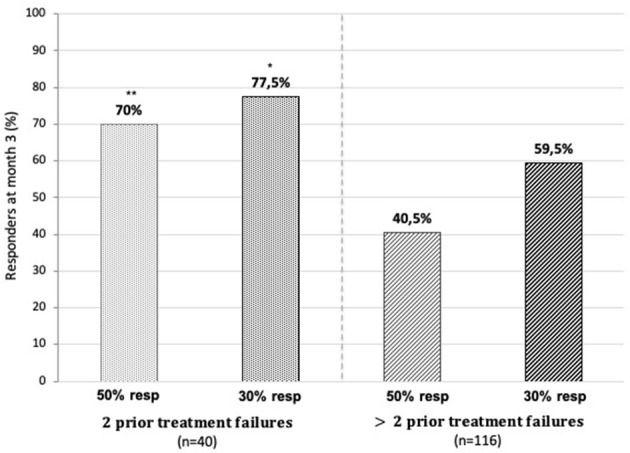
Figure 8.

Fifty and 30% responder rates for monthly headache days at 3 months of treatment in patients with two prior treatment failures (on the left) and those with >two prior failures (on the right). *p < 0.05, **p < 0.01 chi-squared test “two prior failures” vs. “>two prior failures”.
