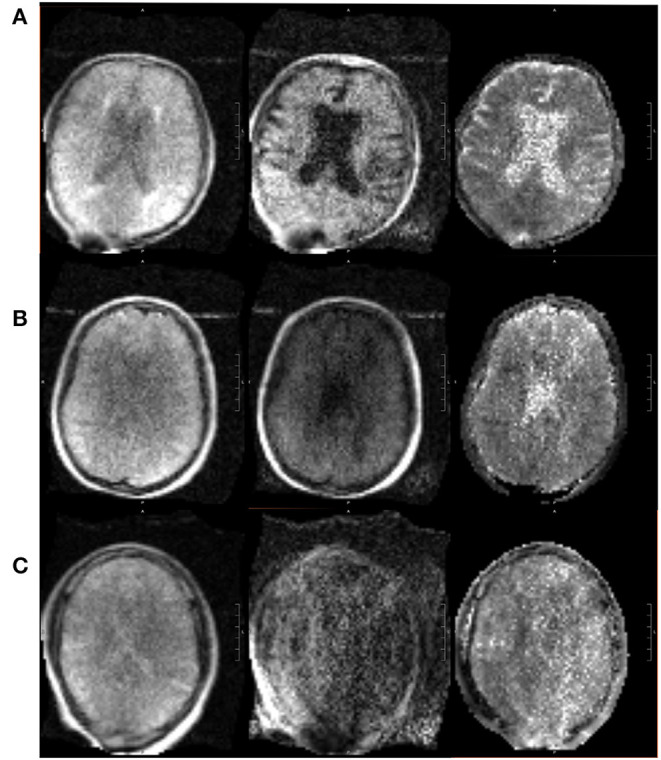
Figure 9.

Range in pMRI DWI quality. Three sample DWI sequences are provided, of varying quality. From left to right: DWI (b = 0), DWI, DWI with ADC map. (A) In a relatively good scan, the sulci are appreciable, ventricles are distinct, and gray vs. white matter can be distinguished. (B) In an average scan, the sulci are less visible, and the ventricles are present but not clearly delineated. (C) In a poor scan, there is significant noise and pixelation such that structures cannot be adequately identified.
