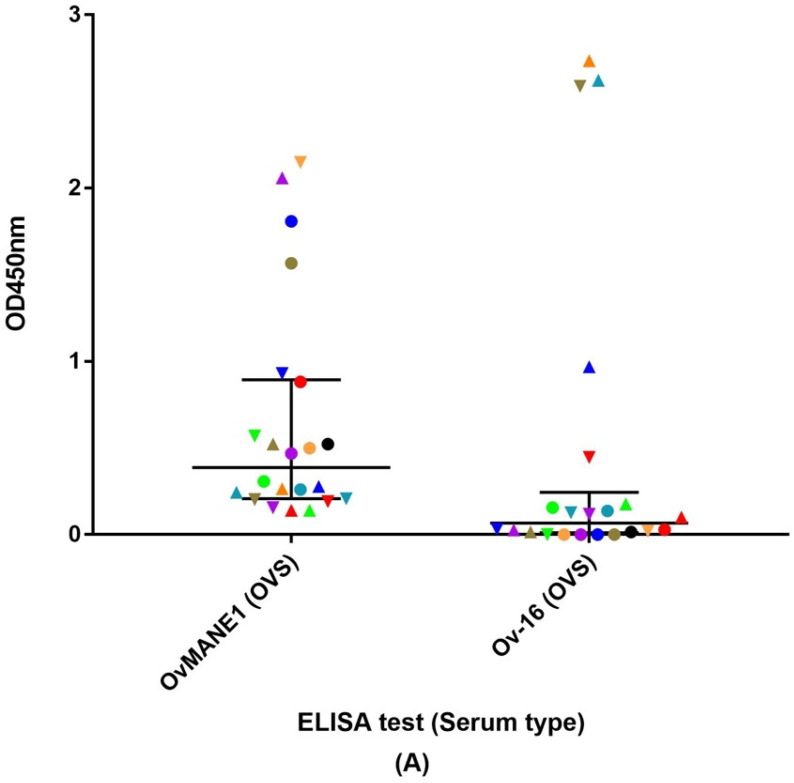
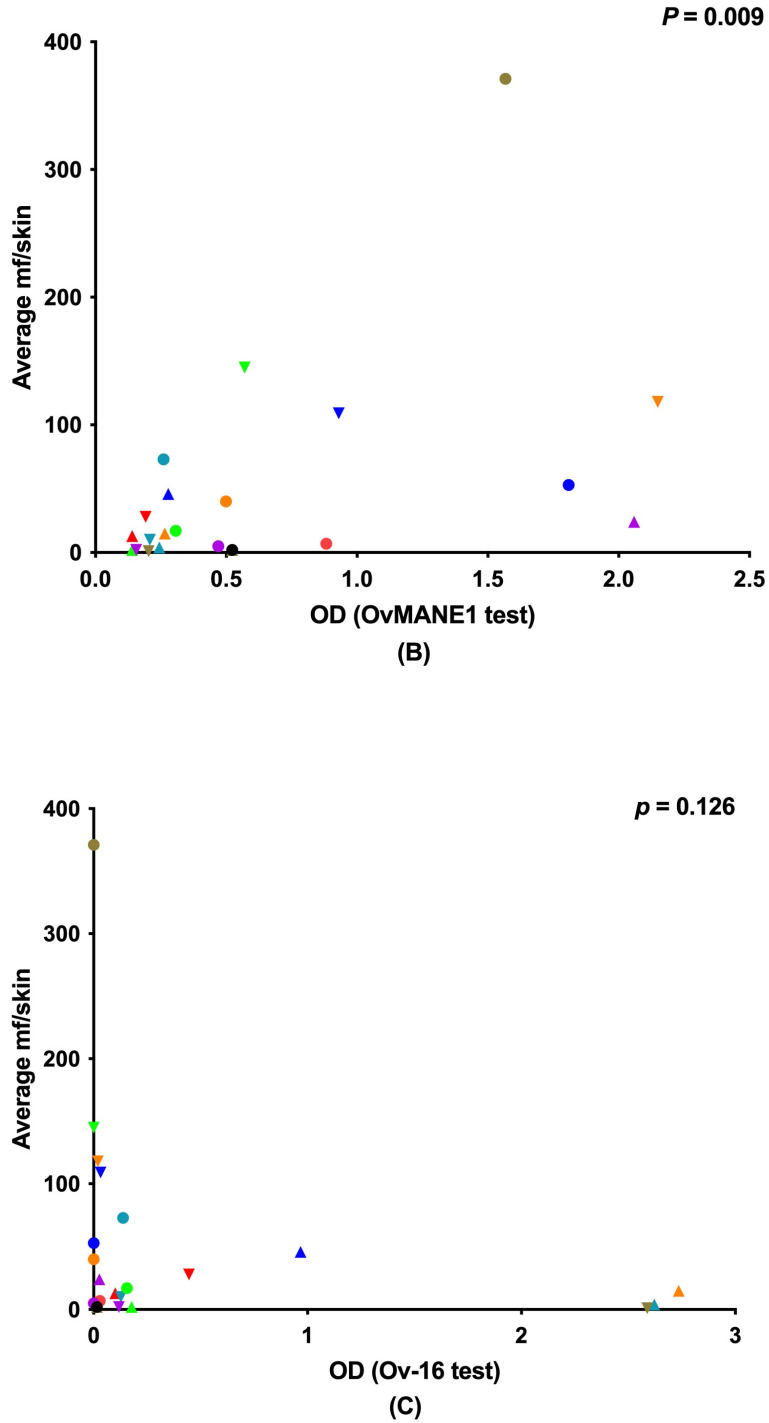
Figure 2.
Analysis of humoral immune response to OvMANE1 and Ov-16 antigens using O. volvulus serum (OVS, n = 22), which were either positive according to OvMANE1 test (n = 11) but not Ov-16 test (n = 11) and vice versa. (A) optical densities (OD) at 450 nm were plotted against OvMANE1 and Ov-16 tests using color codes and shapes to match the specific serum samples in both tests. The average microfilaria (mf) load per skin snip was plotted against (B) the OD of OVS in OvMANE1 test and (C) the OD of OVS in Ov-16 test using color codes and shapes that matches the specific serum sample. Color codes were assigned to each sample to clearly differentiate the OD of the sample in the different tests.


