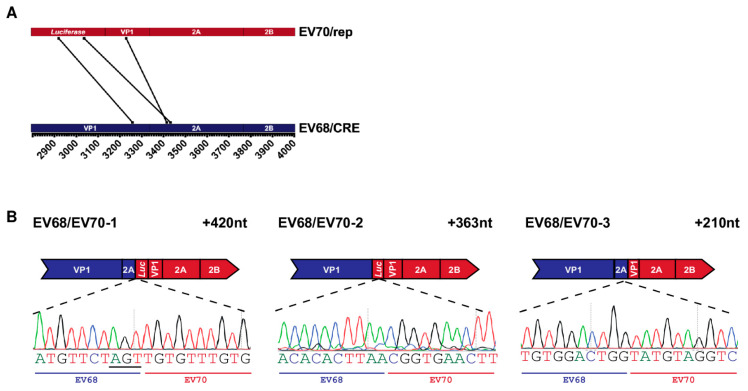
Figure 4.
Recombinant genomes isolated from EV68/EV70 CRE-REP assay: (A) parallel coordinates visualisation of EV68/EV70 recombinant genomes. The location of each recombination junction was mapped respectively to each parental genome. Each line represents a unique recombinant; (B) schematic representation of each identified recombinant. Recombinant name is given top left and the size of each sequence duplication is top right. The relevant part of the recombinant sequence chromatogram is shown below, with the acceptor and donor-derived regions indicated based on the determined junction position. Nucleotides underlined in recombinant sequence represent regions of ambiguity where both parental sequences match. Although labelled as acceptor, it cannot be determined from which template these particular nucleotides were derived.

