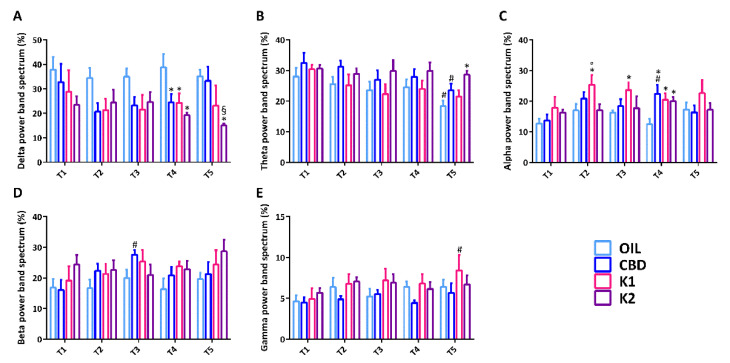
Figure 6.
Power band spectrum analysis after each session of the 6-Hz test. All mice (n = 32) were treated with CBD (n = 8), K1 (n = 8), K2 (n = 8), or olive oil (n = 8). A relative indication of distribution of power over the frequency, expressed in percentage, was determined in seizures induced by the 6-Hz corneal stimulation (A–E). * p < 0.050 vs. OIL; § p < 0.050 vs. CBD; ° p < 0.050 vs. K2; # p < 0.050 vs. first session of the same group, with the same treatment; Duncan’s method. T1–T5, from the first to the fifth session of corneal stimulation; OIL, olive oil; CBD, cannabidiol; K1, hemp oil 1; K2, hemp oil 2.

