Figure 4.
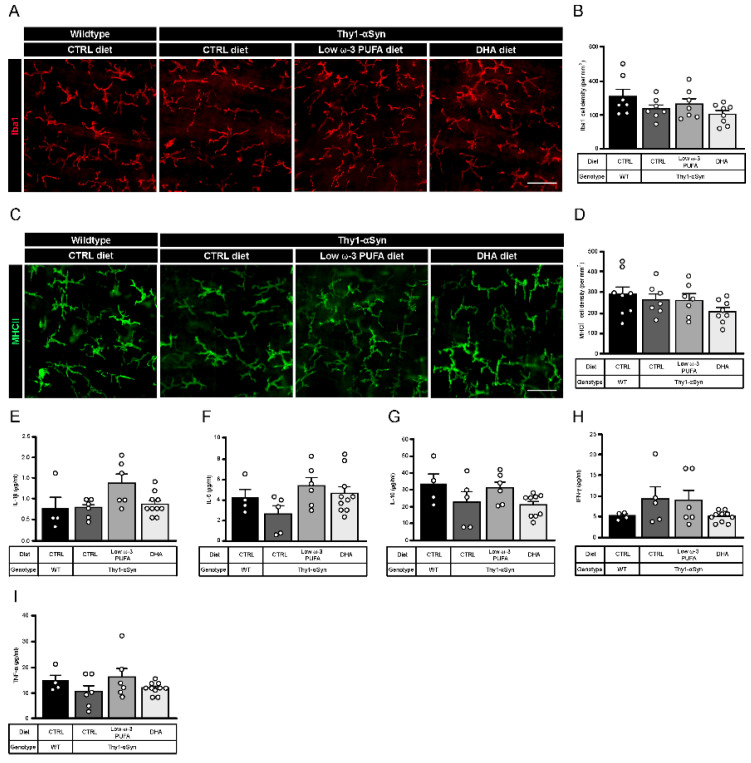
Thy1-αSyn mice do not show change in enteric macrophages and plasma cytokines composition. (A) Photomicrographs of Iba1+ macrophage immunofluorescence (red) in wild-type mice and the Thy1-αSyn model maintained on different diets. Scale bar = 30 μm. (B) Quantification of Iba1+ macrophages by density shows no significant difference between each group (one-way ANOVA: p = 0.1071). (C) Photomicrographs of MHCII+ macrophage immunofluorescence (green) in wild-type mice and the Thy1-αSyn model maintained on different diets. Scale bar = 30 μm. (D) Quantification of MHCII+ macrophages by density shows no significant difference between each group (one-way ANOVA: p = 0.2537). (E–I) Plasma cytokines analysis reveals no difference between mice strains and diets for IL-1β (E), IL-5 (F), IL-10 (G), IFN-γ (H) and TNF-α (I). Abbreviations: CTRL, control; DHA, docosahexaenoic acid; Iba1, ionized calcium-binding adapter molecule 1; IFN-γ, interferon gamma; IL, interleukin; MHCII, major histocompatibility complex class II; TNF-α, tumor necrosis factor alpha; WT, wild-type. (white dots) show an increase of varicosities per 100 μm of dendrites in transgenic mice fed with DHA-enriched diet compared to control diet.

