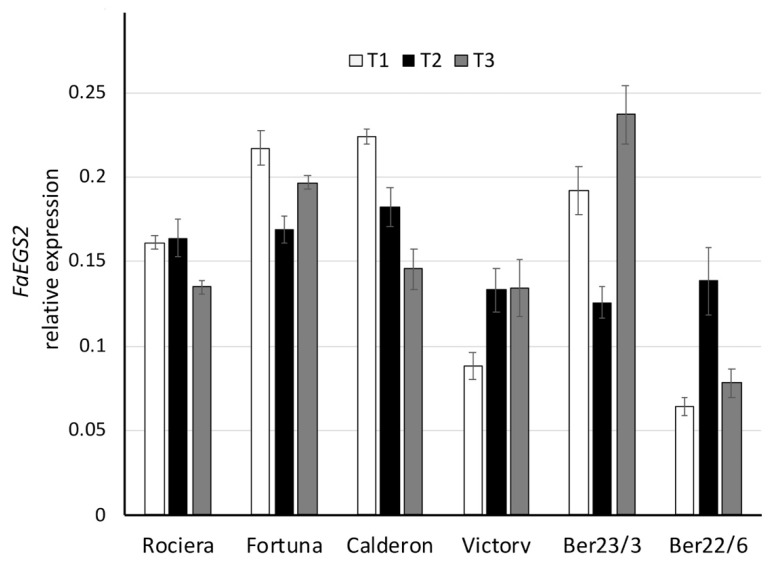
Figure 8.
Comparative analysis of FaEGS2 gene expression at 3 different time points in 6 different strawberry genotypes. Relative FaEGS2 transcript levels were normalized using GAPDH as an internal control gene (expression level = ratio FaEGS2 molecules/GAPDH molecules). Three biological and two technical replicates per sample were used.

