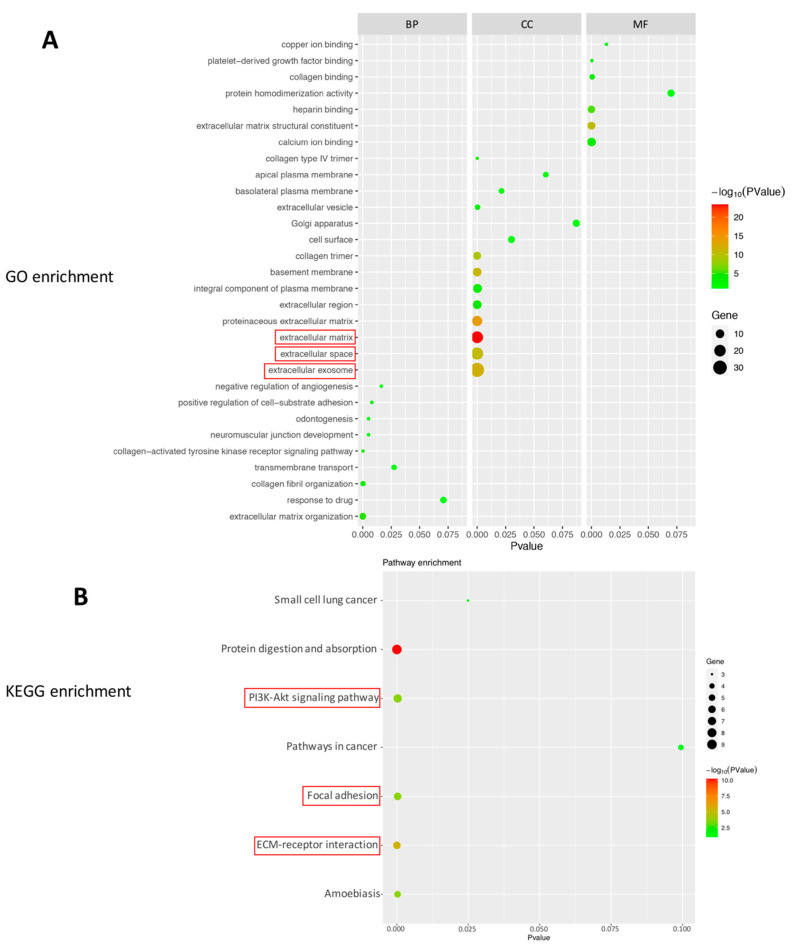
Figure 4.
Enrichment analysis of top 55 up-regulated genes based on DAVID bioinformation resources. (A) Bubble plot of the enriched GO terms: cellular component terms (CC), molecular function terms (MF), biological process terms (BP). The first three pathways with the most genes (smaller p value), and which may be related to protection of photoreceptor cells are as follows: extracellular exosome, extracellular space, and extracellular matrix (red box). (B) Bubble plot of the enriched KEGG pathways. The pathways which may be related to protection of photoreceptor cells are as follows: PI3K–Akt signaling pathway. In addition, there are PI3K–Akt signaling pathway-related pathways: focal adhesion, ECM-receptor interaction (according to the map of PI3K–Akt signaling pathway, https://www.genome.jp/kegg-bin/show_pathway?rno04151 (accessed on 18 June 2021). The colors of the nodes are illustrated from red to green in descending order of –log10 (p value). X-axis: signaling pathway or function; Y-axis: percentage of the number of DEGs assigned to a term among the total number of DEGs annotated in the network; Bubble size: number of DEGs assigned to a pathway or function; Color: enriched p value.

