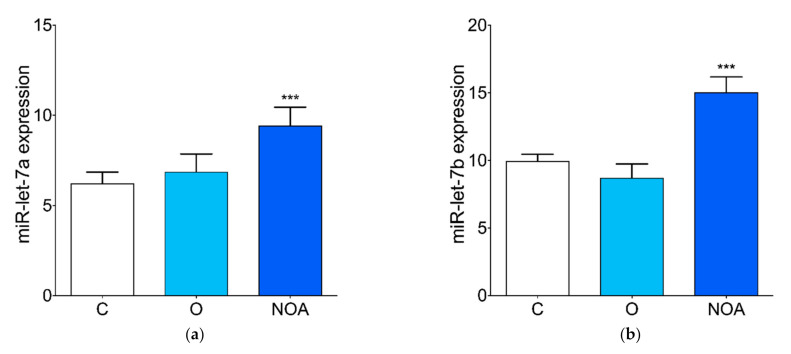
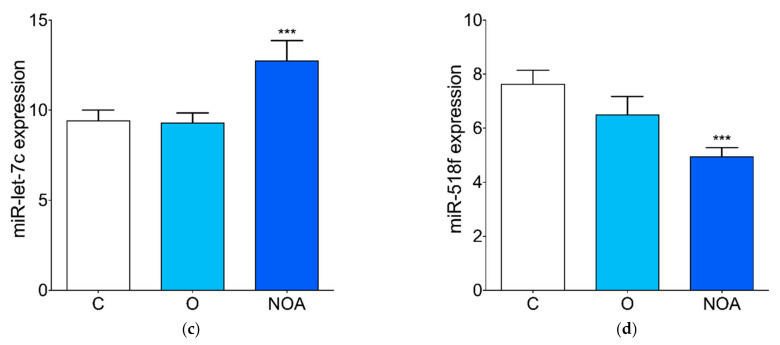
Figure 3.
Expression profile of selected miRNAs in seminal plasma. qPCR analysis of the (a) miR-let-7a, (b) miR-let-7b, (c) miR-let-7c, and (d) miR-518f expression levels in the seminal plasma of the group of men with non-obstructive azoospermia, the group of men with oligoasthenoteratozoospermia, and the control group of healthy men. Asterisk indicates significant differences between the groups (*** p < 0.001). C, control; NOA, non-obstructive azoospermia; O, oligoasthenoteratozoospermia.


