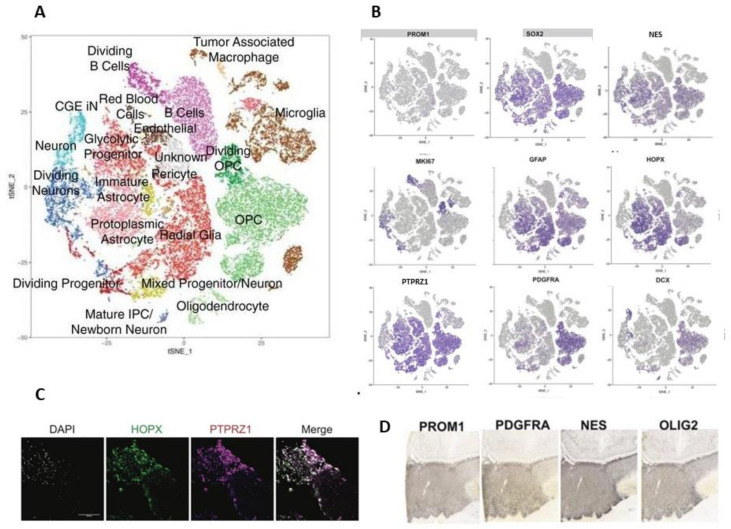
Figure 4.
Single-cell RNA sequencing in glioblastoma. (A). Plot of cells from glioblastoma samples from 16 patients showing clusters colored by attributed cell types. (B). The same cluster representation as in (A), showing the cell-type/cluster-related expression of several genes expressed during neural development in stem and progenitor populations. (C). Immunofluorescence image of a glioblastoma sample showing co-expression of the oRG markers HOPX and PTPRZ1; DAPI nuclear staining (blue); scale bar: 10 μm. (D). Glioblastoma samples from a glioma repository, showing the expression of the proteins PROM1, PDGFRA, nestin (NES) and OLIG2. (Adapted from [84]).

