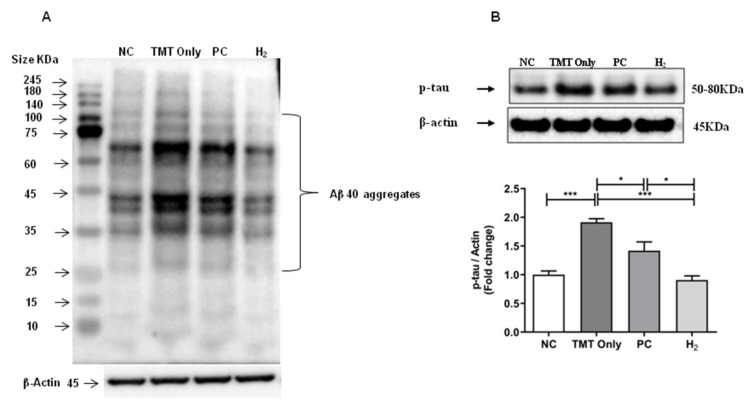
Figure 10.
Effects of H2 gas inhalation treatment on the Aβ-40 (mouse monoclonal- 32A1) and p-tau-(Ser404) protein levels in brain lysates in TMT-induced C57BL/6 mice after four weeks. (A) The antibody-reactive bands of mouse Aβ-40 in the brain lysates, (B) The antibody-reactive band of p-tau-(Ser404) protein levels in brain lysates. The bar graphs represent the band intensity of each protein marker normalized to the total. The data are presented as the mean ± SD of n=3 mice. Significant differences were analyzed with ANOVA and Tukey’s test. * p < 0.05, *** p < 0.001.

