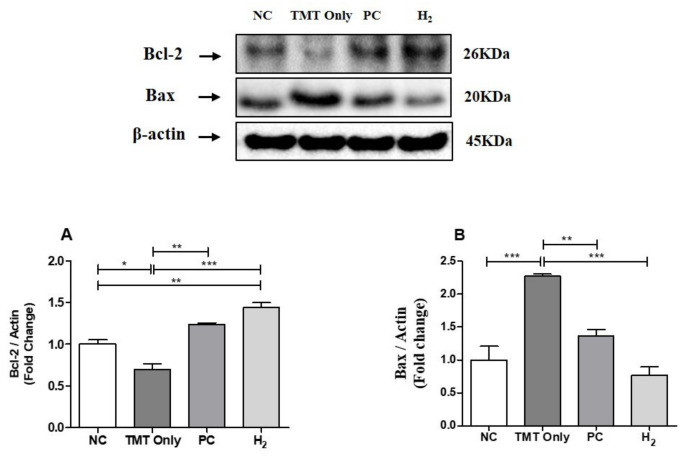
Figure 11.
Effects of H2 gas inhalation treatment on the Bcl-2 and Bax protein levels in brain lysates of TMT-induced C57BL/6 mice after four weeks. (A) The antibody-reactive quantified band intensity of Bcl-2 in the brain lysates, (B) The antibody-reactive quantified band intensity of Bax protein in brain lysates. The bar graphs represent the band intensity of each protein marker normalized to the total. The data are presented as the mean ± SD for n = 3 mice. Significant differences were analyzed with ANOVA and Tukey’s test. * p < 0.05, ** p < 0.01, *** p < 0.001.

