Figure 4.
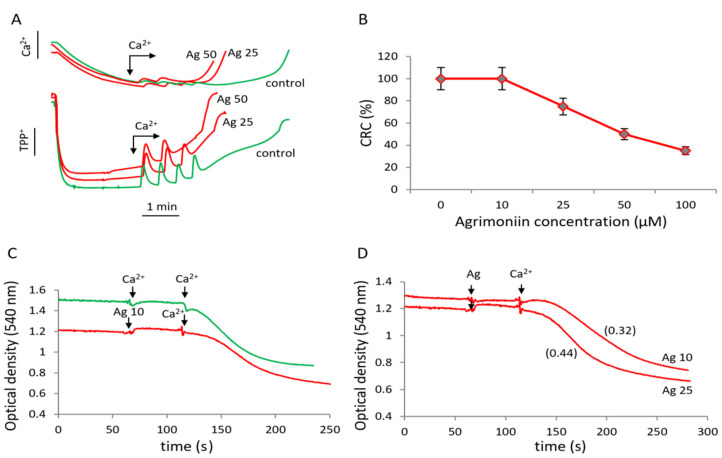
Influence of agrimoniin on MPTP opening induced by calcium ions. (A)influence of agrimoniin (Ag) on membrane potential (lower curves) and induction of calcium efflux (upper curves) in the course successive CaCl2 additions of 25 µM each in the control (green curves) and after agrimoniin (25 µM and 50 µM) additions (red curves). (B)calcium retention capacity (CRC)decreased by agrimoniin at different concentrations; the data represent the average values from five experiments. (C) induction of mitochondrial swelling by calcium ions in the control (green curve) and in the presence of 10 µM agrimoniin (red curve). (D) swelling rates in the presence of 10 µM and 25 µM agrimoniin. Swelling rates are indicated in parentheses.

