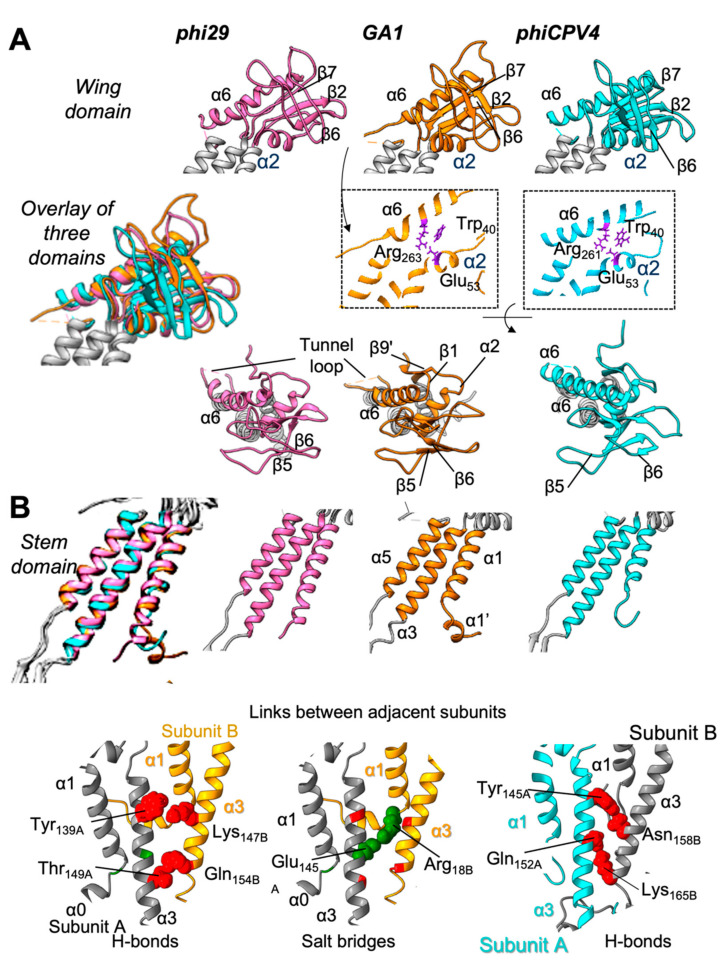
Figure 4.
Comparison of the wing and stem domains of the GA1 and phiCPV4 portal proteins. (A) Wing domains of phi29 (in pink), GA1(in orange), and phiCPV4 (in cyan). Middle panels show thin slices through helices 6 and 2 indicating interactions within the core of the wings. (B) Stem domains of phi29, GA1, and phiCPV4 (colour coding as in A), comprising helices α1, α3, and α5. The bottom panel shows interactions between helices of adjacent subunits α3A and α3B in GA1, and in phiCPV4. Hydrogen bonds are shown in red; a salt bridge is indicated in green.

