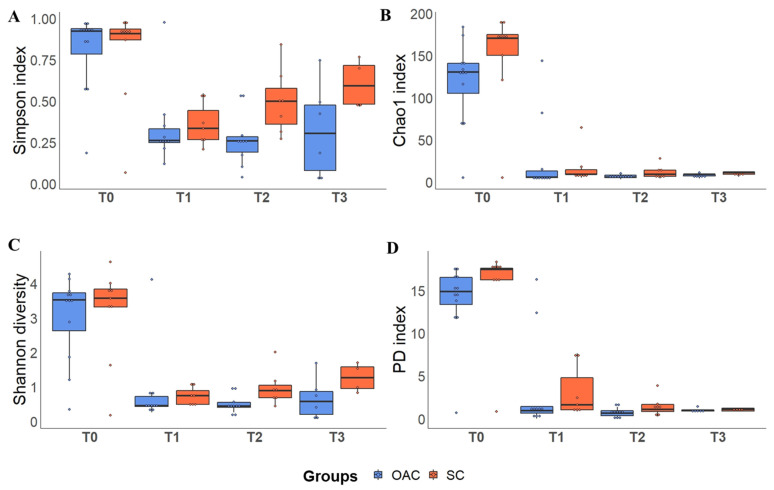
Figure 4.
Alpha diversity indices (Simpson—(A); Chao 1—(B); Shannon—(C) and PD—(D)) between groups over time. Boxplots show the median, 25% percentile and 75% percentile of the diversity indexes of each group. Dots represent each sample. Legend: PD: Faith’s Phylogenetic Diversity Index; T0 (first day of life), T1 (7 days after birth), Time 2 (14 days after birth), Time 3 (21 days after birth).

