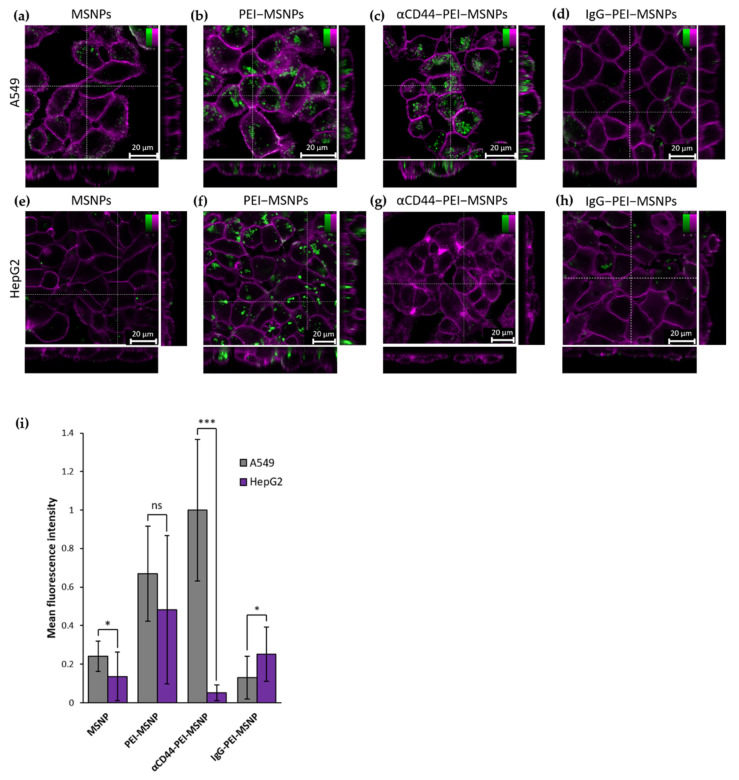
Figure 4.
Confocal fluorescence microscopy images showing the influence of different MSNP coatings on the uptake of nanoparticles in A549 and HepG2 cells. Internalization of bare MSNP (a,e), PEI-coated MSNPs (PEI-MSNP, panels (b,f)), CD44-functionalized MSNPs (αCD44-PEI-MSNP, panels (c,g)), and IgG-functionalized MSNPs (IgG-PEI-MSNP, panels d,h) in A549 cells (a–d) and HepG2 cells (e–h). Nanoparticles were loaded with Fluorescein (FITC, green) and the plasma membrane was stained with DiR (magenta). The central square represents a single xy plane, while the bottom and left panels are the xz and yz cross-sections, indicated by the dashed lines. Scale bar is 20 μM; color bars display the intensity values. (i) Normalized mean fluorescence intensity of MSNP, PEI-MSNP, αCD44-PEI-MSNPs, and IgG-PEI-MSNPs internalized in A549 and HepG2 (20 cells per condition). The data were analyzed using Fiji (see Methods section for details). With ns: not significant, * (p < 0.05), *** (p < 0.001).

