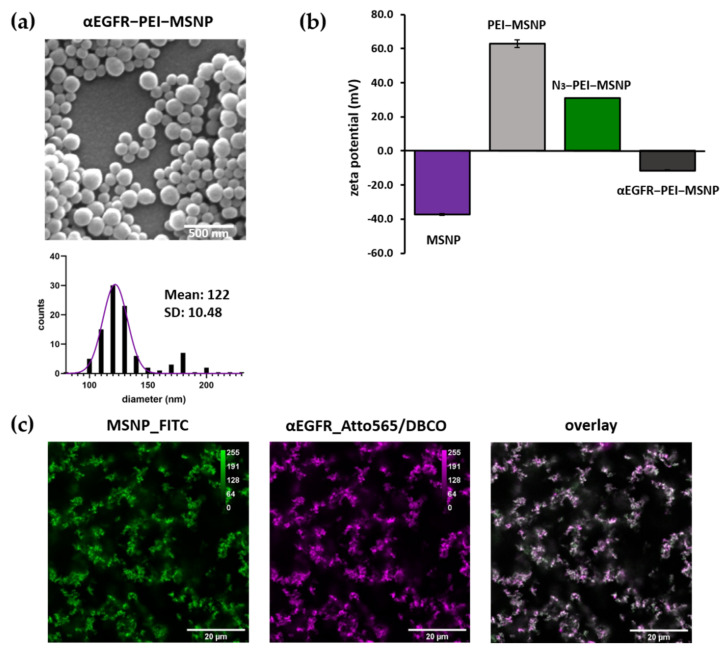
Figure 9.
Characterization of EGFR-conjugated (αEGFR-PEI-MSNPs) mesoporous silica nanoparticles. (a) Representative SEM image and size distribution of the imaged particles (values shown as mean ± SD). Scale bar is 500 nm. (b) Zeta-potential measurements. (c) Confocal fluorescence images of sedimented nanoparticles on glass showing the overlay (third panel) of FITC-encapsulated MSNPs (first panel, green) and the Atto565/DBCO-labelled EGFR antibody (second panel, magenta).

