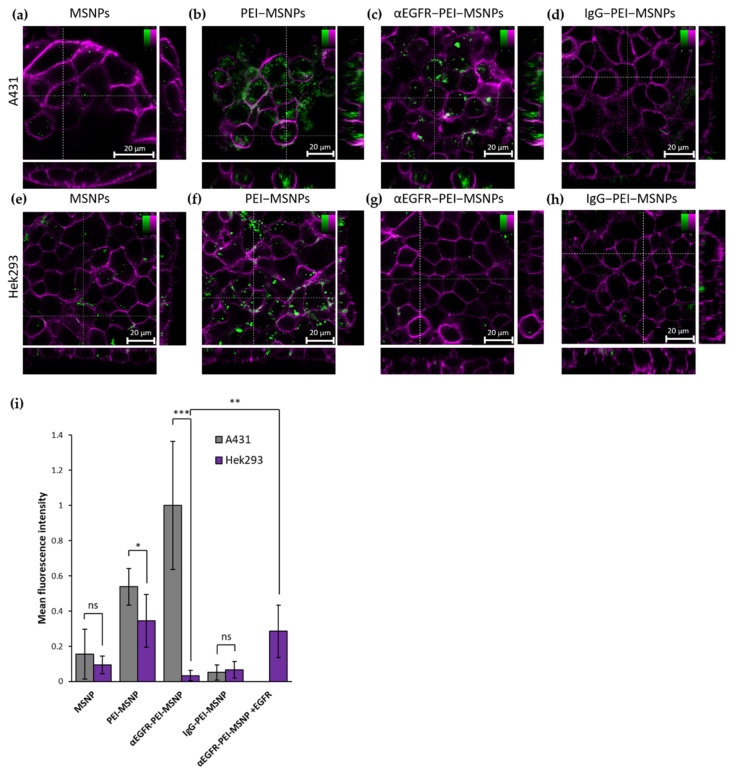
Figure 10.
Confocal fluorescence microscopy stacks showing the influence of different MSNP coatings in A431 and Hek293 cells. (a–d) Internalization of MSNP, PEI-MSNP, αEGFR-PEI-MSNP, and IgG-PEI-MSNP in A431 cells (from left to right). (e–h) Internalization of MSNP, PEI-MSNP, αEGFR-PEI-MSNP, and IgG-PEI-MSNP in Hek293 cells (from left to right). Nanoparticles (encapsulated with fluorescein) are displayed in green and the plasma membrane is stained with DiR (magenta). Scale bar is 20 μM; color bars display the intensity values. (i) Normalized mean fluorescence intensity of MSNP, PEI-MSNP, αEGFR-PEI-MSNPs, and IgG-PEI-MSNPs internalized in A431 and Hek293 cells and αEGFR-PEI-MSNPs in Hek293 cells transiently expressing EGFR (Hek293 + EGFR, 20 cells per condition). The data were analyzed using Fiji (see Methods section for details). With ns: not significant, * (p < 0.05), ** (p < 0.01), and *** (p < 0.001).

