
Figure 8.
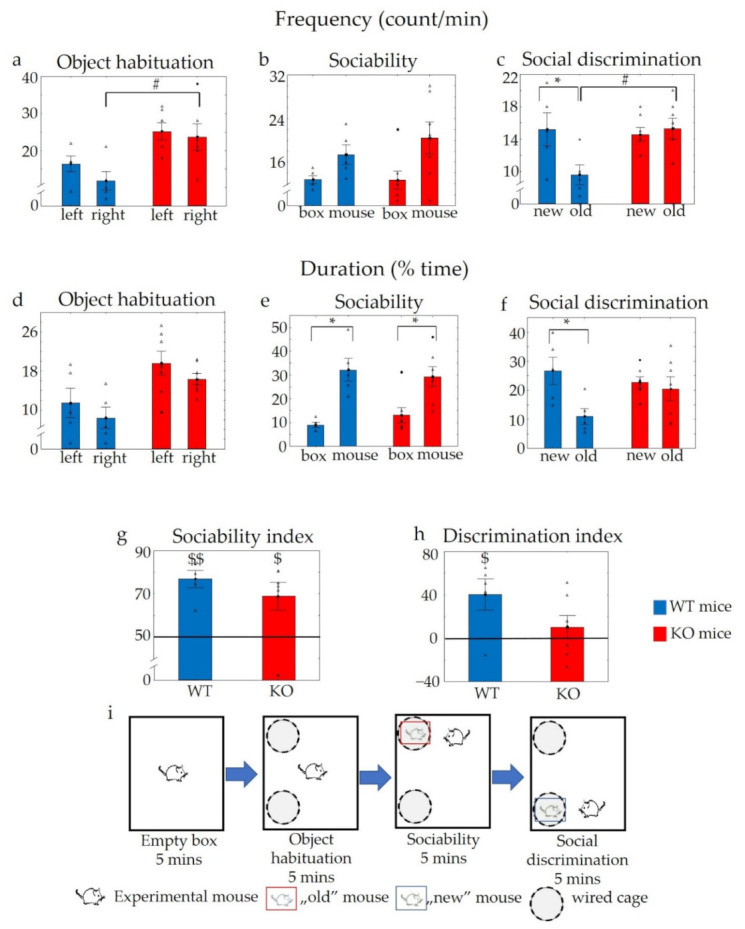
Results of the sociability test. During the object habituation phase, the KO animals investigated the objects more times than the WTs (a), but the difference in the duration was not significant (d). During the sociability phase, increased interest was detected towards the social stimulus in both groups without significant genotype differences (b,e). During the social discrimination phase, WT animals demonstrated increased interest towards the novel stimulus mice, but this kind of difference were not detectable in KO mice (c,f). Both genotypes revealed significant social interest as represented by a sociability index higher than 50% (g). However, only WTs showed intact short-term social memory as represented by a discrimination index higher than 0 (h). Schematic representation of the sociability trial (i). n = 5 in WT and n = 7 in KO groups, the symbol # shows a significant difference between KO and WT mice (p < 0.05); * shows a significant difference between the two sides with wired cages, in cases with * p < 0.05; $ shows a significant difference in the same group using a single sample t-test, in cases with $ p < 0.05, and $$ p < 0.01. Blank triangles represent individual values while dark spots show outliers (characterized by a higher or lower value than mean ± 2 standard deviation (SD)).