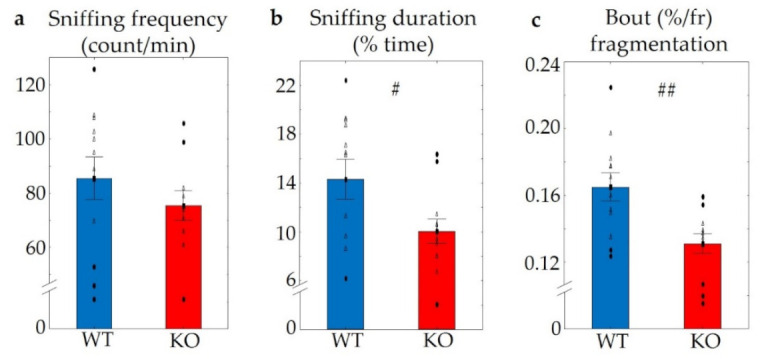
Figure 9.

Results of the social interaction test. No differences were detected in the frequency of social behaviour between the two genotypes (a); however, a decreased duration of sniffing (b) and bout fragmentation (c) were detected in KO mice. n = 12 in both groups, the symbol # shows a significant difference, in cases with # p < 0.05, and ## p < 0.01. Blank triangles represent individual values while dark spots show outliers (characterized by a higher or lower value than mean ± 2 standard deviation (SD)).
