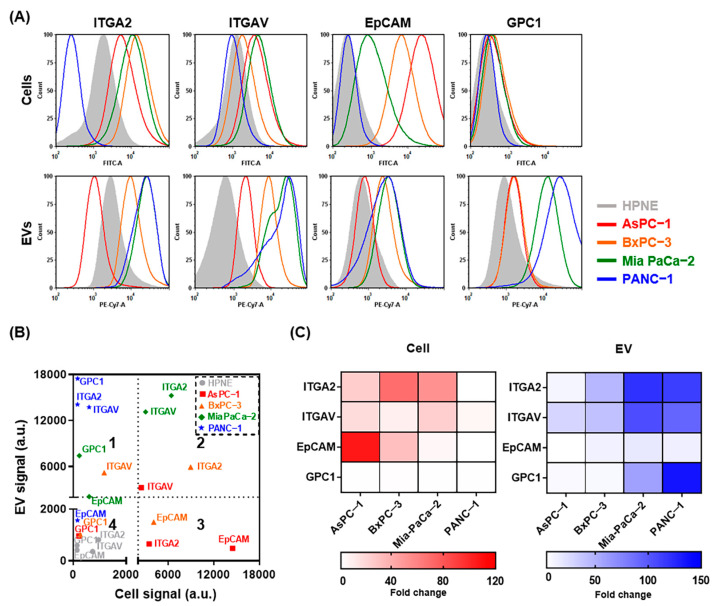
Figure 2.
Characterization of pancreatic cancer-associated surface markers on the surface of cells and EVs. (A) Representative fluorescence-activated cell sorting (FACS) histograms of ITGA2, ITGAV, EpCAM, and GPC1 expression on cells (upper) and EVs (lower) using Alexa Fluor 488 and PE-Cy7−labeled antibodies. (B) Correlation between surface marker expression on cells (X-axis) vs. EVs (Y-axis). Dotted cutoff lines are shown at the mean fluorescence intensity (MFI) value of 2000. (C) Heat map of surface marker expression in pancreatic cancer cells (red) and EVs (blue) compared with the normal pancreas control cell line HPNE.

