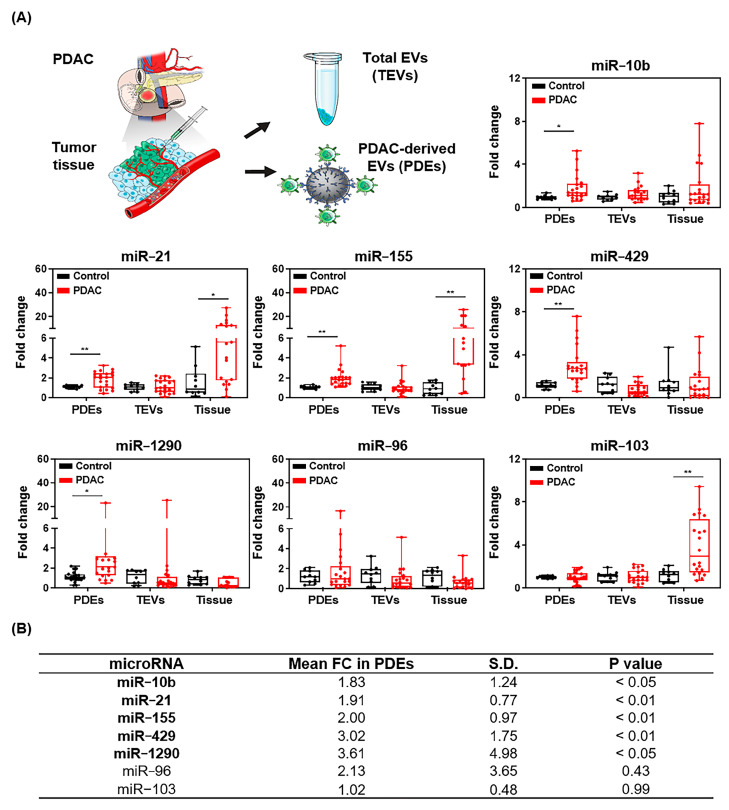
Figure 6.
Differential miRNA expression in samples from 20 PDAC patients compared with the normal control. (A) Fold changes of candidate miRNA expression in PDEs, TEVs, and tumor tissue. (B) Mean fold changes, standard deviations, and P values of candidate miRNAs in PDEs. Upregulated miRNA candidates that were upregulated in PDEs are shown in bold. * p < 0.05, ** p < 0.01 benign control vs. PDAC in each groups.

