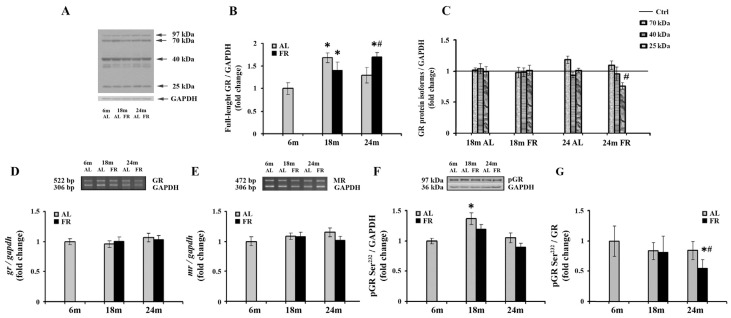
Figure 2.
The effect of food restriction on the levels of glucocorticoid and mineralocorticoid receptors in the rat cortex during aging. (A) Representative blot with full-length glucocorticoid receptor protein and shorter GRα protein isoforms (molecular weights indicated). Relative protein levels of the full-length glucocorticoid receptor (B), 70 kDa, 40 kDa, and 25 kDa GR isoforms additionally normalized to the values obtained in control (Ctrl.), 6-month-old animals presented as the line (C), GR mRNA (D), mineralocorticoid receptor (MR) mRNA (E), and GR phosphorylated at Ser232 (pGR) (F) were determined in rats fed ad libitum (AL) (gray bars) or subjected to food restriction (FR) (black bars). (G) The level of GR phosphorylated at Ser232 relative to the level of total GR. Data are presented as the mean ± SEM of fold changes relative to the values obtained in control, 6-month-old AL animals (n = 6). * p < 0.05 vs. 6-month-old rats; # p < 0.05 vs. age-matched AL rats.

