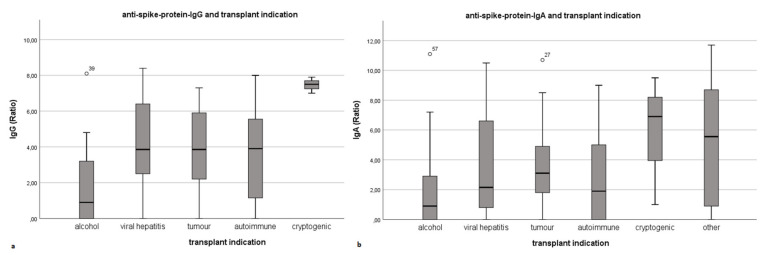
Figure 4.
Influence of transplant indication on anti-spike-protein-IgG- and IgA-levels as box plots. (a,b) show the significant influence of the underlying disease on anti-spike-protein-IgG- and IgA-levels. Ratio = dimensionless unit; quotient of the extinction value of the patient sample and the calibrator. Box plots present means, interquartile range (IQR), minimum and maximum with each individual bar.

