Figure 3.
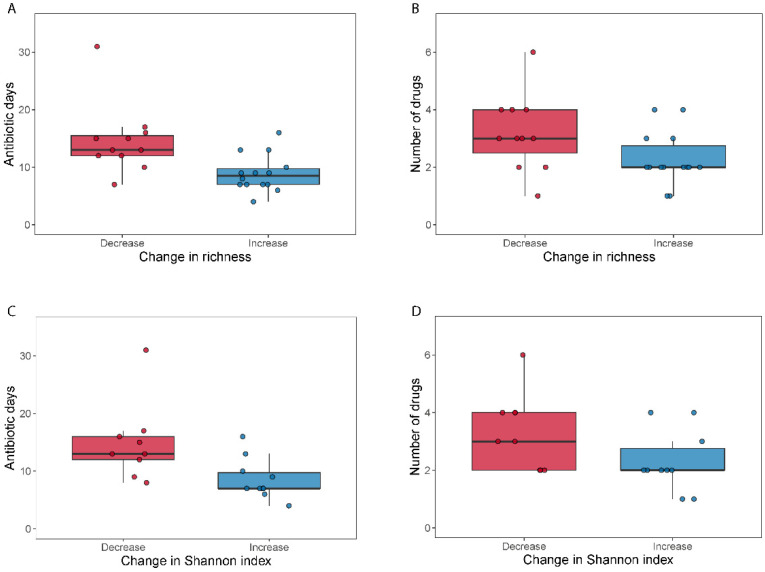
Selection pressure (antibiotic days) and number of antibiotics used related to a change in alpha diversity. Boxplots (A–D) show the total days on antibiotics and the number of antibiotics for patients who either decreased (“Decrease”) or increased (“Increase”) their diversity (calculated as MGS richness or Shannon index) during broad-spectrum antibiotic treatment.

