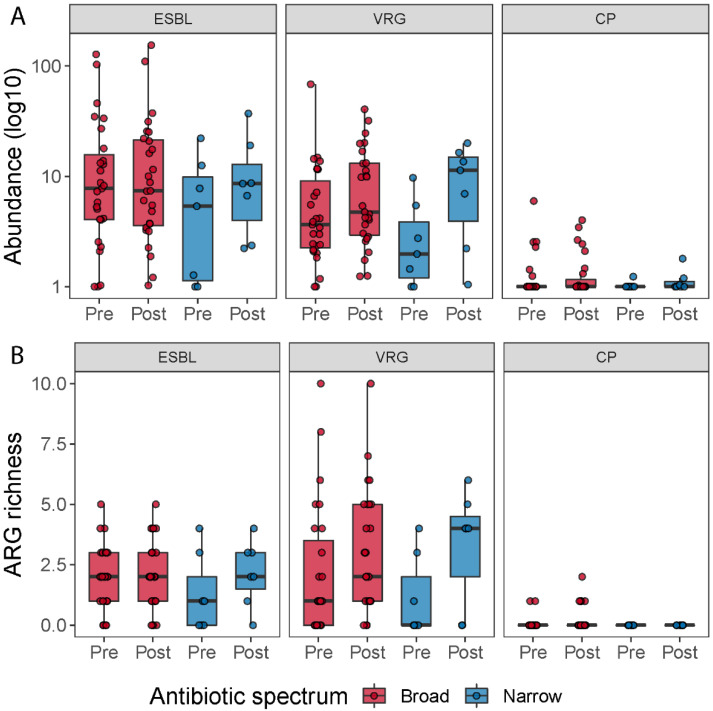
Figure 6.
ARG richness for the ESBL, vancomycin resistance genes (VRG) and carbapenemase resistance gene groups (CP) (A). Boxplots show the resistance genes detected across the samples belonging to these three types of resistance genes by time and treatment. ESBL, vancomycin resistance and carbapenemase-producing resistance gene abundance for each treatment (B). Boxplots show the abundance of resistance genes (in log 10 scale) associated with ESBL, vancomycin resistance genes and carbapenemase resistance genes pre- and post-treatment, respectively.

