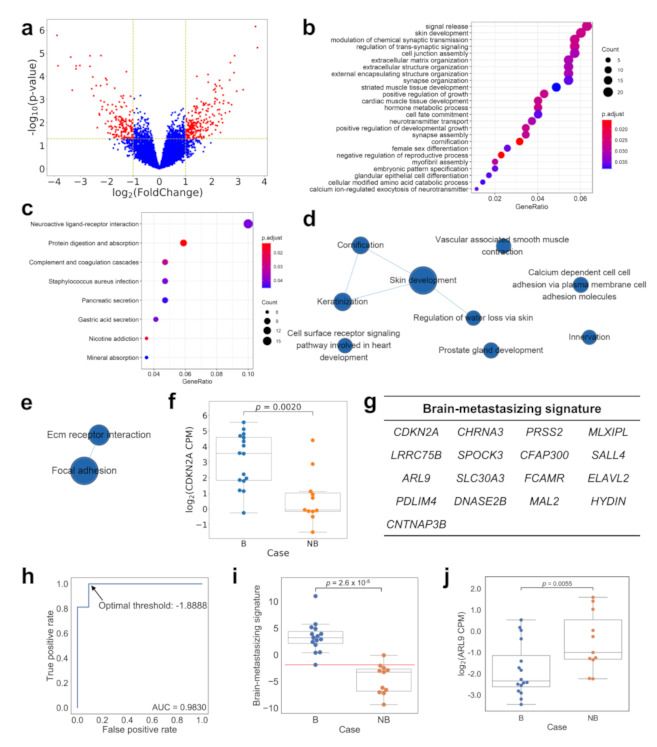
Figure 2.

Comparing the gene expression profile of brain-metastasizing and non-brain-metastasizing lung adenocarcinomas using RNA-seq. The Volcano plot (panel (a)) showed differentially expressed genes (DE genes) with at least two-fold expression difference and p < 0.05 between the two groups by DESeq2. A total of 390 genes were identified. The GO enrichment analysis (panel (b)) and the KEGG pathway enrichment analysis (panel (c)) of the DE genes highlighted multiple groups of genes and pathways, notably the cellular interaction with extracellular matrix. The visualization of enriched GO terms or KEGG pathways were presented with clusterProfiler [10], and only the top 10 enriched GO terms were shown. The GSEA with GO (panel (d)) and KEGG (panel (e)) also found an enrichment of several similar gene sets, which were visualized by EnrichmentMap [11]. However, when the ability of the individual DE gene to segregate the two groups of tumors was analyzed, the top gene with the greatest AUC value in the ROC analysis was CDKN2A. The dot plot (panel (f)) of CDKN2A expression showed that while brain-metastasizing tumors have a range of expression levels, most non-brain-metastasizing tumors express very little of this gene (p = 0.0020, Mann–Whitney U test). A 17-gene brain-metastasizing signature (panel (g)) was identified for classification. The optimal threshold was determined as −1.89, as indicated in the ROC curve (panel (h)). The dot plot (panel (i)) showed that the brain-metastasizing signature was significantly higher in the brain-metastasizing group (p = 2.6 × 10⁻⁵, Mann–Whitney U test). The red line indicated the optimal threshold for classification. The dot plot (panel (j)) of ARL9 expression showed that the expression was significantly lower in brain-metastasizing tumors (p = 0.0055, Mann–Whitney U test). B: brain-metastasizing, NB: non-brain-metastasizing.
