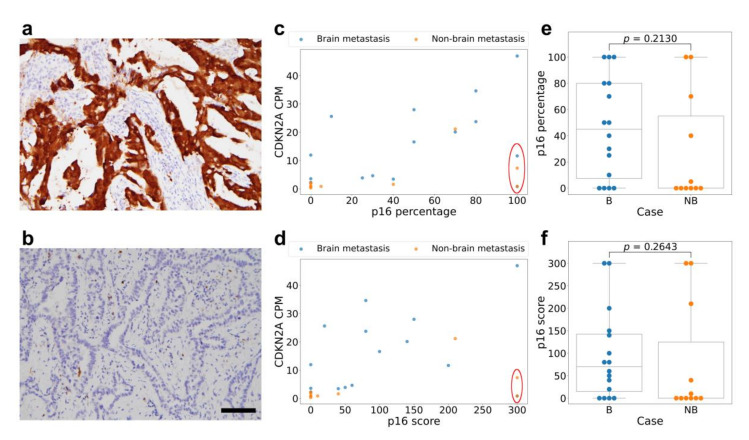
Figure 3.
The p16 immunohistochemical staining of lung adenocarcinoma tissue shows a moderate correlation with the CDKN2A RNA expression. Representative photographs show one tumor with 100% strong-intensity (3+) p16 staining (panel (a)) compared to another tumor with 0% (negative, 0 intensity) staining (panel (b)). The percentage of tumor cells positive for p16 shows a moderate correlation with the CDKN2A RNA expression level (panel (c)), but the correlation is not significant for the p16 staining H-score (panel (d)). Note that 4 cases deviating from the correlation form a group and share the feature of low CDKN2A RNA expression and high p16 positive percentage and score (red circle). Of these cases, 2 belong to the brain metastasizing group and 2 belong to the non-brain-metastasizing group. Box plots of p16-positive percentage (panel (e)) and p16 H-score (panel (f)) show that the brain-metastasizing cases tend to have a variable staining of p16, some reaching high levels, while non-brain-metastasizing cases tend to have low p16 staining. However, the difference was not clear-cut nor statistically significant (p = 0.21 for the percentage and 0.26 for the H-score, Mann–Whitney U test). Scale bar: 100 micrometer. B: brain-metastasizing, NB: non-brain-metastasizing.

