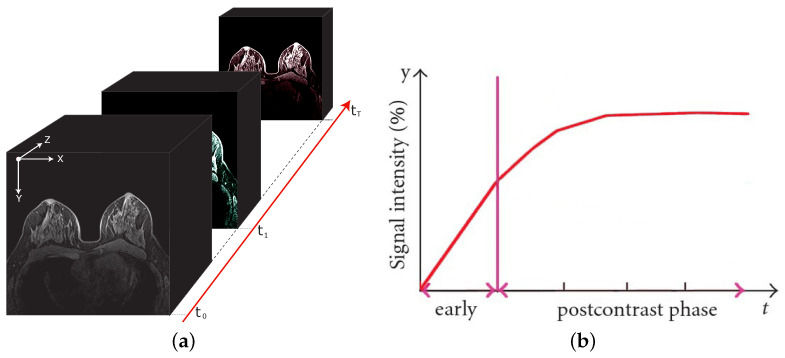
Figure 1.
A breast DCE-MRI study and an illustrative time intensity curve. On the left (a), the 4D multimodal volume, with the signal intensity variations reflecting the contrast agent flow over time. On the right (b), the corresponding (illustrative) time intensity curve for a single voxel. The vertical line separates the pre-contrast (early) from post-contrast injection instants.

