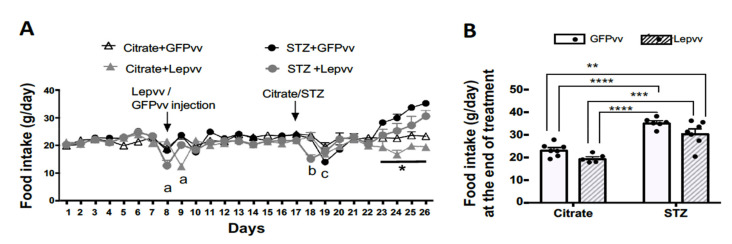
Figure 1.
Food intake changes in male rats that were injected with Lepvv or GFPvv on day 8 followed by injection with citrate buffer or STZ (to induced diabetes) on day 17. (A) Profile of food intake (g/day, mean ± SEM) in diabetic and non-diabetic rats treated with Lepvv or GFPvv. Citrate + GFPvv (n = 7); STZ + GFPvv (n = 6); Citrate + Lepvv (n = 5) and STZ + Lepvv (n = 7) are represented. Data were analyzed using linear mixed models as described under Statistics. “a” indicates significant difference (p < 0.01) between Lepvv-injected rats and the other groups on days 8–9, “b” indicates significant difference (p < 0.0001) between diabetic rats injected with Lepvv and the other groups on day 18 and “c” indicates difference between GFPvv-injected diabetic and non-diabetic rats on day 19 (p < 0.01). * indicates p < 0.05 between Lepvv + citrate group and the other groups. (B) Average food intake on the 9th day after STZ/citrate injection (g, mean ± SEM). Data were analyzed by 2-way ANOVA followed by Tukey’s multiple comparisons test. Food intake was significantly reduced in the GFPvv-treated diabetic group compared to the citrate groups (**** p < 0.0001). Food intake in the Lepvv-treated diabetic animals was also increased compared to the citrate groups, but to a lesser extent (** p < 0.01; *** p < 0.001).

