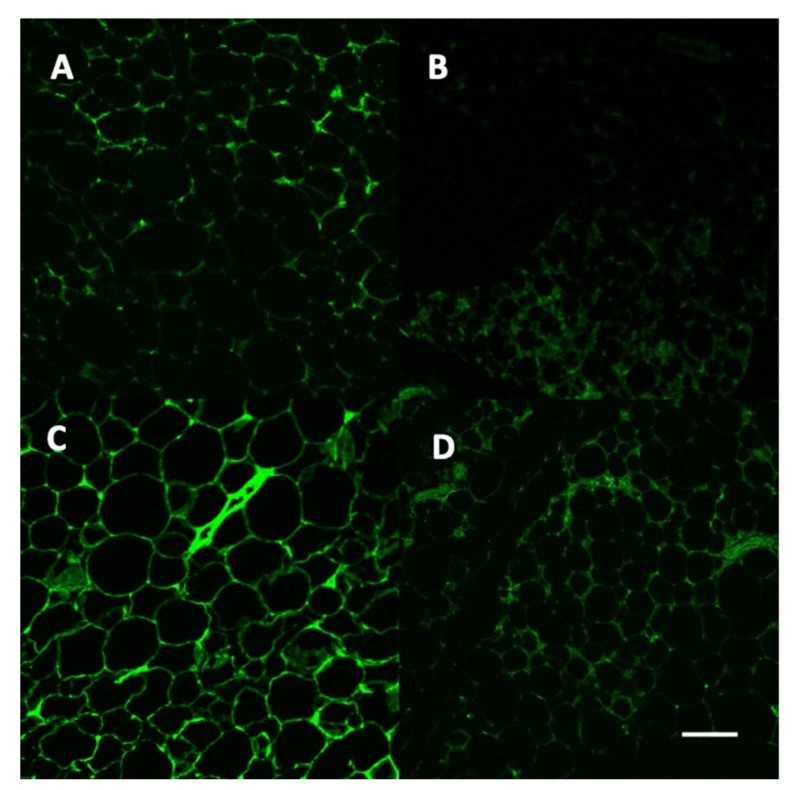
Figure 6.
Representative images of adipose tissue from animals in the four groups using a confocal microscope; 20× objective. Panel (A): Citrate + GFPvv; Panel (B): STZ + GFPvv, Panel (C): Citrate + Lepvv; Panel (D): STZ + Lepvv. Green fluorescent protein indicates the presence of GFPvv in panels (A,B) and Lepvv in panels (C,D). Scale bar represents 200 µm.

