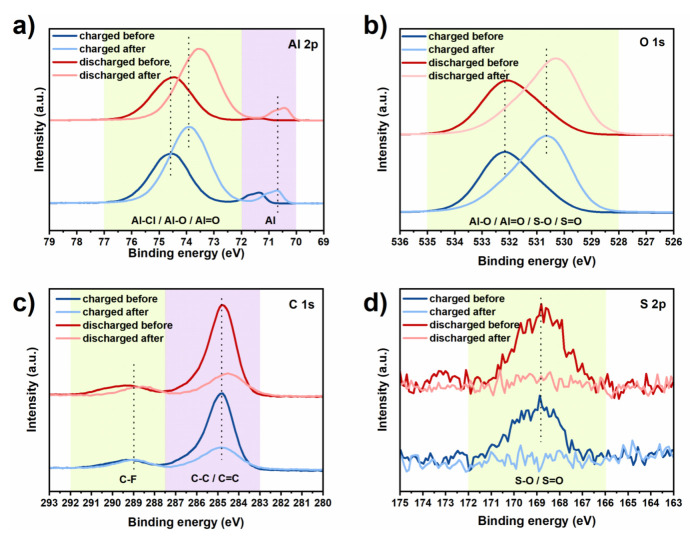
Figure 2.
High−resolution X−ray photoelectron spectroscopy (XPS) spectra of the Al anode, in charged and discharged states, before and after the etching step: (a) Al 2p, (b) O 1s, (c) C 1s and (d) S 2p. The dashed lines are guides for the eyes. The legends of chemical bonds refer to the regions (outlined in green and purple colored background) where they are commonly found.

