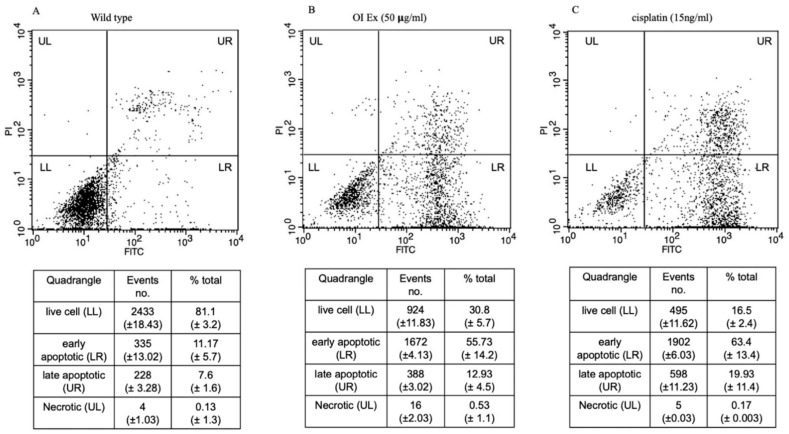
Figure 6.
Dot plots of Annexin V-FITC and PI staining to evaluate apoptosis HSC-3 cells following O. indicum treatment. HSC-3 cells were treated with 50 μg/mL OI for 8 h, then incubated with annexin V-FITC and PI, and flow cytometry was used to examine the results. (A) Control—cells that are negative for both PI and annexin V-FITC are shown in the lower-left quadrant. (B) OI extract treatment—annexin positive cells (early apoptotic) in the lower right quadrant, annexin and PI-positive cells in the upper right quadrant (late apoptosis cells). (C) Cisplatin (15 ng/mL) treatment—Annexin positive cells in the lower right quadrant, and annexin and PI-positive cells in the upper right quadrant.

