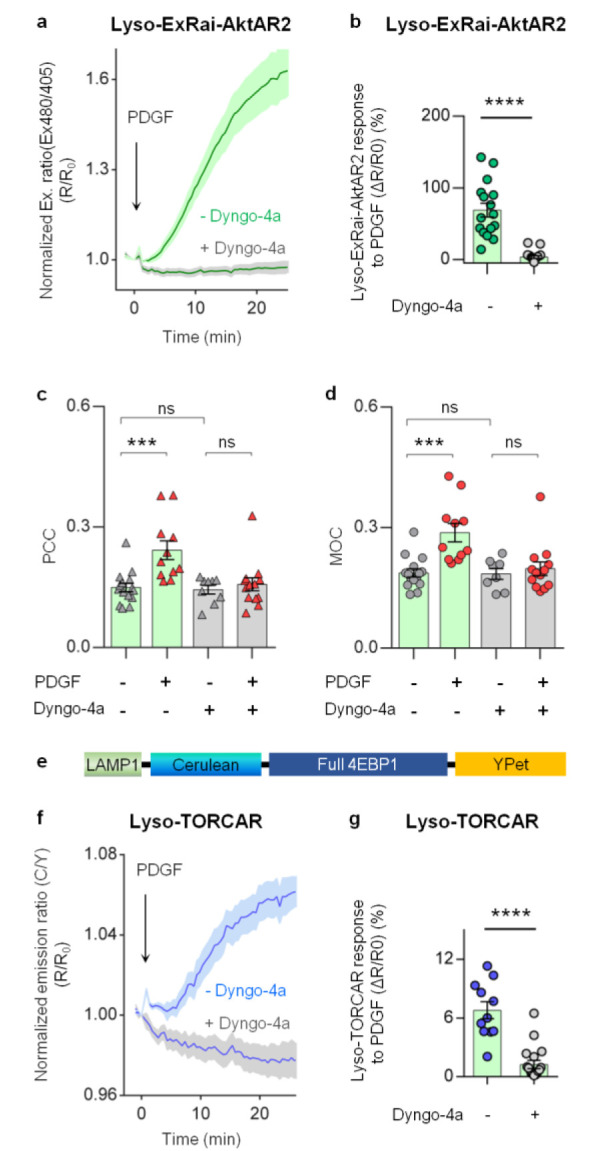
Figure 5.

Lysosomal Akt/mTORC1 signaling activities are dependent on endocytosis. (a) Average time courses of normalized excitation ratio (R: Ex480/405) in serum-starved NIH3T3 cells expressing lysosome-targeted ExRai-AktAR2 (Lyso-ExRai-AktAR2) stimulated with 50 ng/mL of PDGF without (green, n = 16) or with 50 μM Dyngo-4a pretreatment for 10 min (gray, n = 20). (b) Responses of Lyso-ExRai-AktAR2 in PDGF-treated serum-starved NIH3T3 cells without (n = 16) or with pretreatment of Dyngo-4a (n = 20). ****, P < 0.0001; unpaired two-tailed Student’s t test with Welch’s correction. (c) Pearson correlation coefficient (PCC) analysis of Akt and lysosome colocalization in serum-starved NIH3T3 cells without (gray triangle) or with PDGF stimulation (red triangle) in the absence or presence of 50 μM Dyngo-4a. In the absence of Dyngo-4a: ***, P = 0.0006, – PDGF vs + PDGF; In the presence of Dyngo-4a: ns, not significant, P = 0.94, – PDGF vs + PDGF; Without PDGF stimulation: ns, not significant, P = 0.99, – Dyngo-4a vs + Dyngo-4a; Ordinary one-way ANOVA followed by Tukey’s multiple comparison test. (d) Mander’s overlap coefficient (MOC) analysis of colocalization of Akt and the lysosome in serum-starved NIH3T3 cells without (gray dots) or with PDGF stimulation (red dots) in the absence of presence of 50 μM Dyngo-4a. In the absence of Dyngo-4a: ***, P = 0.0003, – PDGF vs + PDGF; In the presence of Dyngo-4a: ns, not significant, P = 0.96, – PDGF vs + PDGF; Without PDGF stimulation: ns, not significant, P = 1.0, – Dyngo-4a vs + Dyngo-4a; Ordinary one-way ANOVA followed by Tukey’s multiple comparison test. (e) Domain structure of lysosome-targeted TORCAR (Lyso-TORCAR). (f) Average time courses of normalized emission ratio (cyan/yellow) in serum-starved NIH3T3 cells expressing Lyso-TORCAR stimulated with 50 ng/mL of PDGF without (blue, n = 11) or with 50 μM Dyngo-4a pretreatment for 10 min (gray, n = 18). (g) Responses of Lyso-TORCAR in PDGF-treated serum-starved NIH3T3 cells without (n = 11) or with pretreatment of Dyngo-4a (n = 18). ****, P < 0.0001; unpaired two-tailed Student’s t test. Solid lines in (a, f) indicate mean responses; shaded areas, SEM. Bars denote mean ± SEM (b–d, g).
