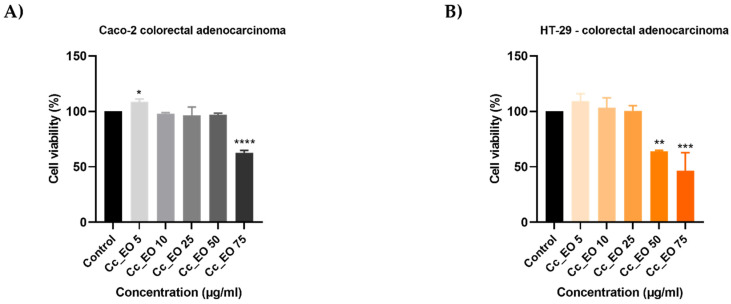
Figure 2.
In vitro assessment of the effect Cc_EO (5, 10, 25, 50, and 75 µg/mL) exerts on the viability of (A) Caco-2 and (B) HT-29 colorectal adenocarcinoma cells after 48 h of treatment by applying the MTT assay. The data are presented as viability percentages (%) normalized to control (untreated cells) and expressed as mean values ± SD of three independent experiments performed in triplicate. The statistical differences between the control and the treated group were identified by applying the one-way ANOVA analysis followed by the Dunett’s multiple comparisons post-test (* p < 0.1; ** p < 0.01; *** p < 0.001; **** p < 0.0001).

