Figure 6.
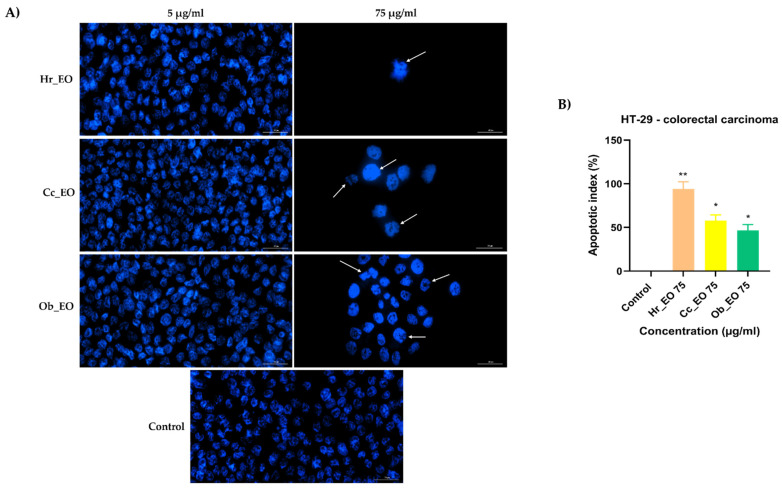
(A) Images of the cellular nuclei stained using Hoechst 33342 reagent in HT-29 CRC cells following the 48 h treatment with Hr_EO, Cc_EO, and Ob_EO (5 and 75 µg/mL) and (B) calculated apoptotic index (AI) percentages for the highest concentration tested (75 µg/mL). The arrows indicate nuclei expressing apoptotic features. The scale bars represent 30 µm. Data are presented as an apoptotic index (%) normalized to control and expressed as mean values ± SD of three independent experiments. The statistical differences between control and the treated group were verified by applying the one-way ANOVA analysis followed by Dunnett’s multiple comparisons post-test (* p < 0.1; ** p < 0.01).

