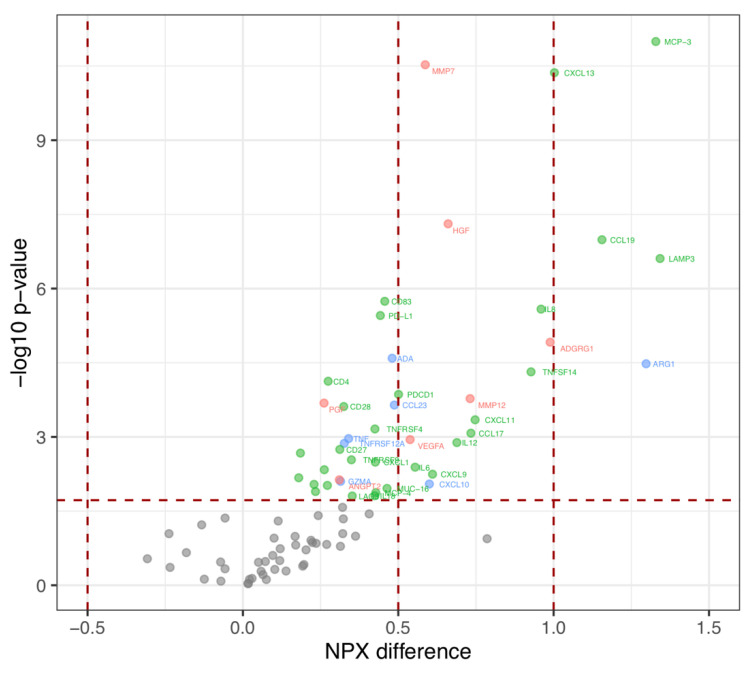
Figure 2.
Levels of circulating proteins in IPF patients versus controls. Volcano plot of the difference in relative protein amount (NPX) (x-axis) by log10 of p-value. Red: proteins associated with tissue remodeling; Green: proteins associated with inflammation/chemotaxis; Blue: proteins with overlapping functions. One-way ANOVA adjusted for age with Benjamini–Hochberg corrected p-value to control a false discovery rate at 5%.

