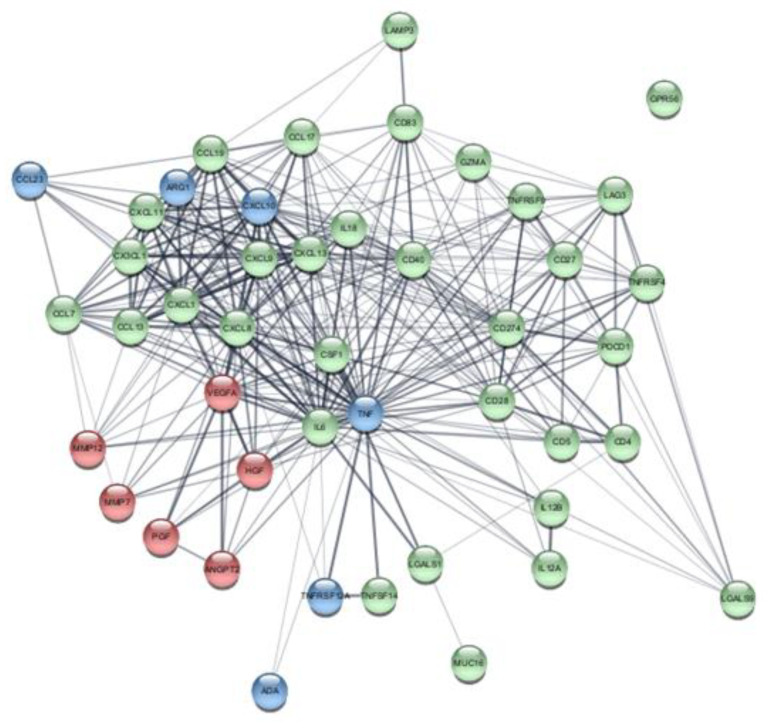
Figure 3.
Bioinformatic analysis of elevated proteins in IPF serum. Network of protein-protein interaction of significantly elevated proteins in IPF serum at baseline compared to healthy controls Annotated biological functions are highlighted with color-coded nodes. Nodes categorized according to biological function; Red nodes = tissue remodeling, Green nodes = inflammation/chemotaxis, Blue nodes = overlapping functions.

