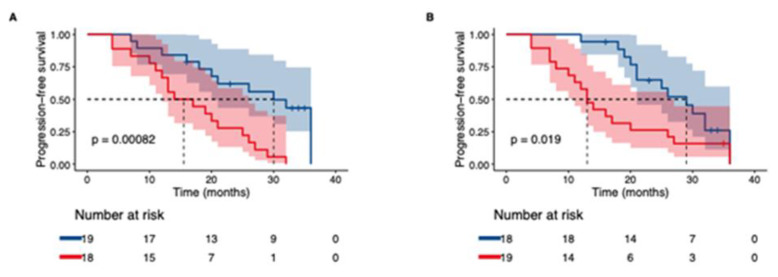
Figure 5.
Kaplan–Meier curves for time to first IPF-progression (defined as ≥ 10% relative decline in FVC% or ≥15% decline in DLCO%). Lung function tests over a 36 months period from baseline were considered. Groups are stratified by protein change (elevation/reduction) observed at follow up. For each biomarker, red indicates the group of patients with elevated levels of respective protein observed at follow up. Blue indicates the group of patients with decreasing levels of protein observed at follow up. (A) MMP7, (B) TNFRSF12A.

