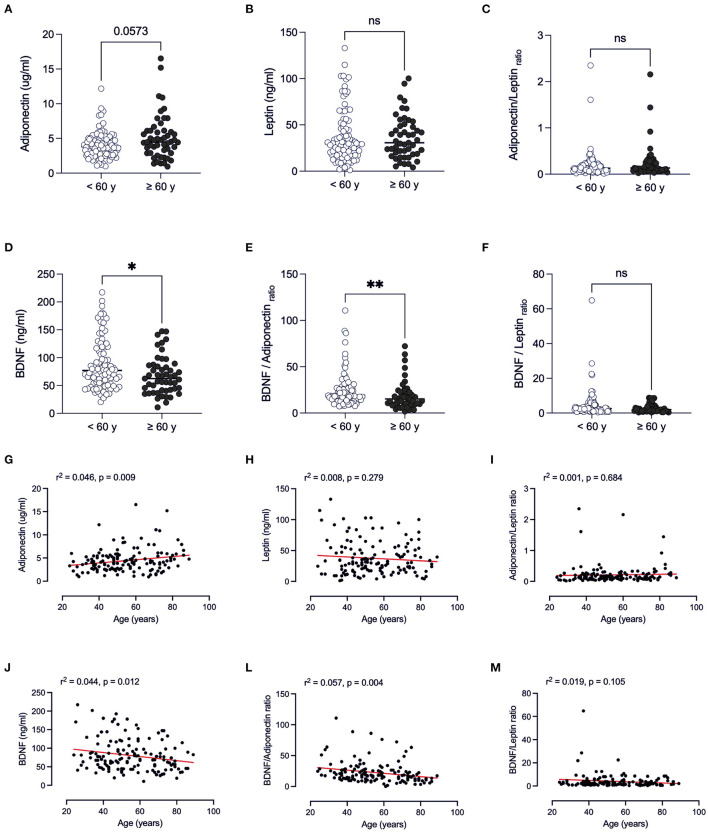
Figure 3.
Comparison of adipose-derived hormone levels between age ranges (<60 years vs. ≥60 years) of patients with Covid-19. Values expressed as median of adiponectin (ug/ml) (A), leptin (ng/ml) (B), adiponectin/leptin ratio (C), BDNF (ng/ml) (D), BDNF/Adiponectin ratio (E), BDNF/Leptin ratio (F), BDNF / Adiponectin/Leptin ratio (G) were compared between two groups. Dashed box presents linear regression curve of adiponectin (G), leptin (H), adiponectin/leptin ratio (I); BDNF (J), BDNF/Adiponectin ratio (L), BDNF/Leptin ratio (M) as dependent variable (Y axis) with age as independent variable (X axis). Significance: *p < 0.05; **p < 0.01.

