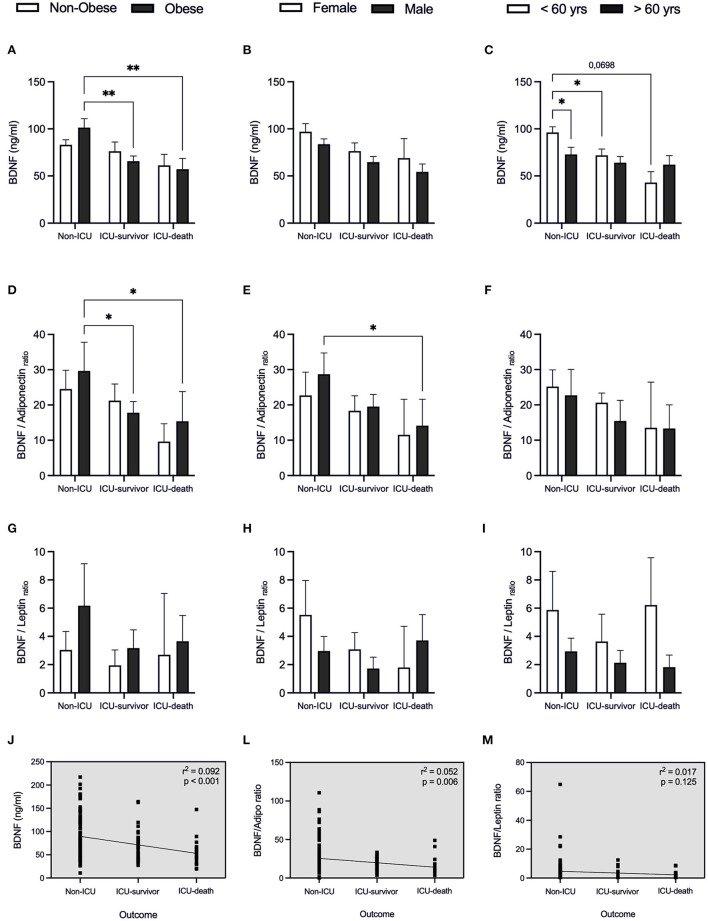
Figure 5.
BDNF and BDNF-related ratios for patients with COVID-19 in relation to clinical outcome. Values expressed as mean with 95% Confidence Interval for patients that were hospitalized without intensive care (Non-ICU), patients admitted to the intensive care unit and discharged (ICU-survivor) and patients who died (ICU-death), including: BDNF (A–C), BDNF/adiponectin ratio (D–F), and BDNF/leptin ratio (G–I) related to body index mass (BMI), sex and age, respectively. Dashed box presents linear regression curve of adiponectin (J), leptin (L), and adiponectin/leptin ratio (M) as dependent variable (Y axis) with outcome as independent variable (X axis). Significance: *p < 0.05; **p < 0.01.

