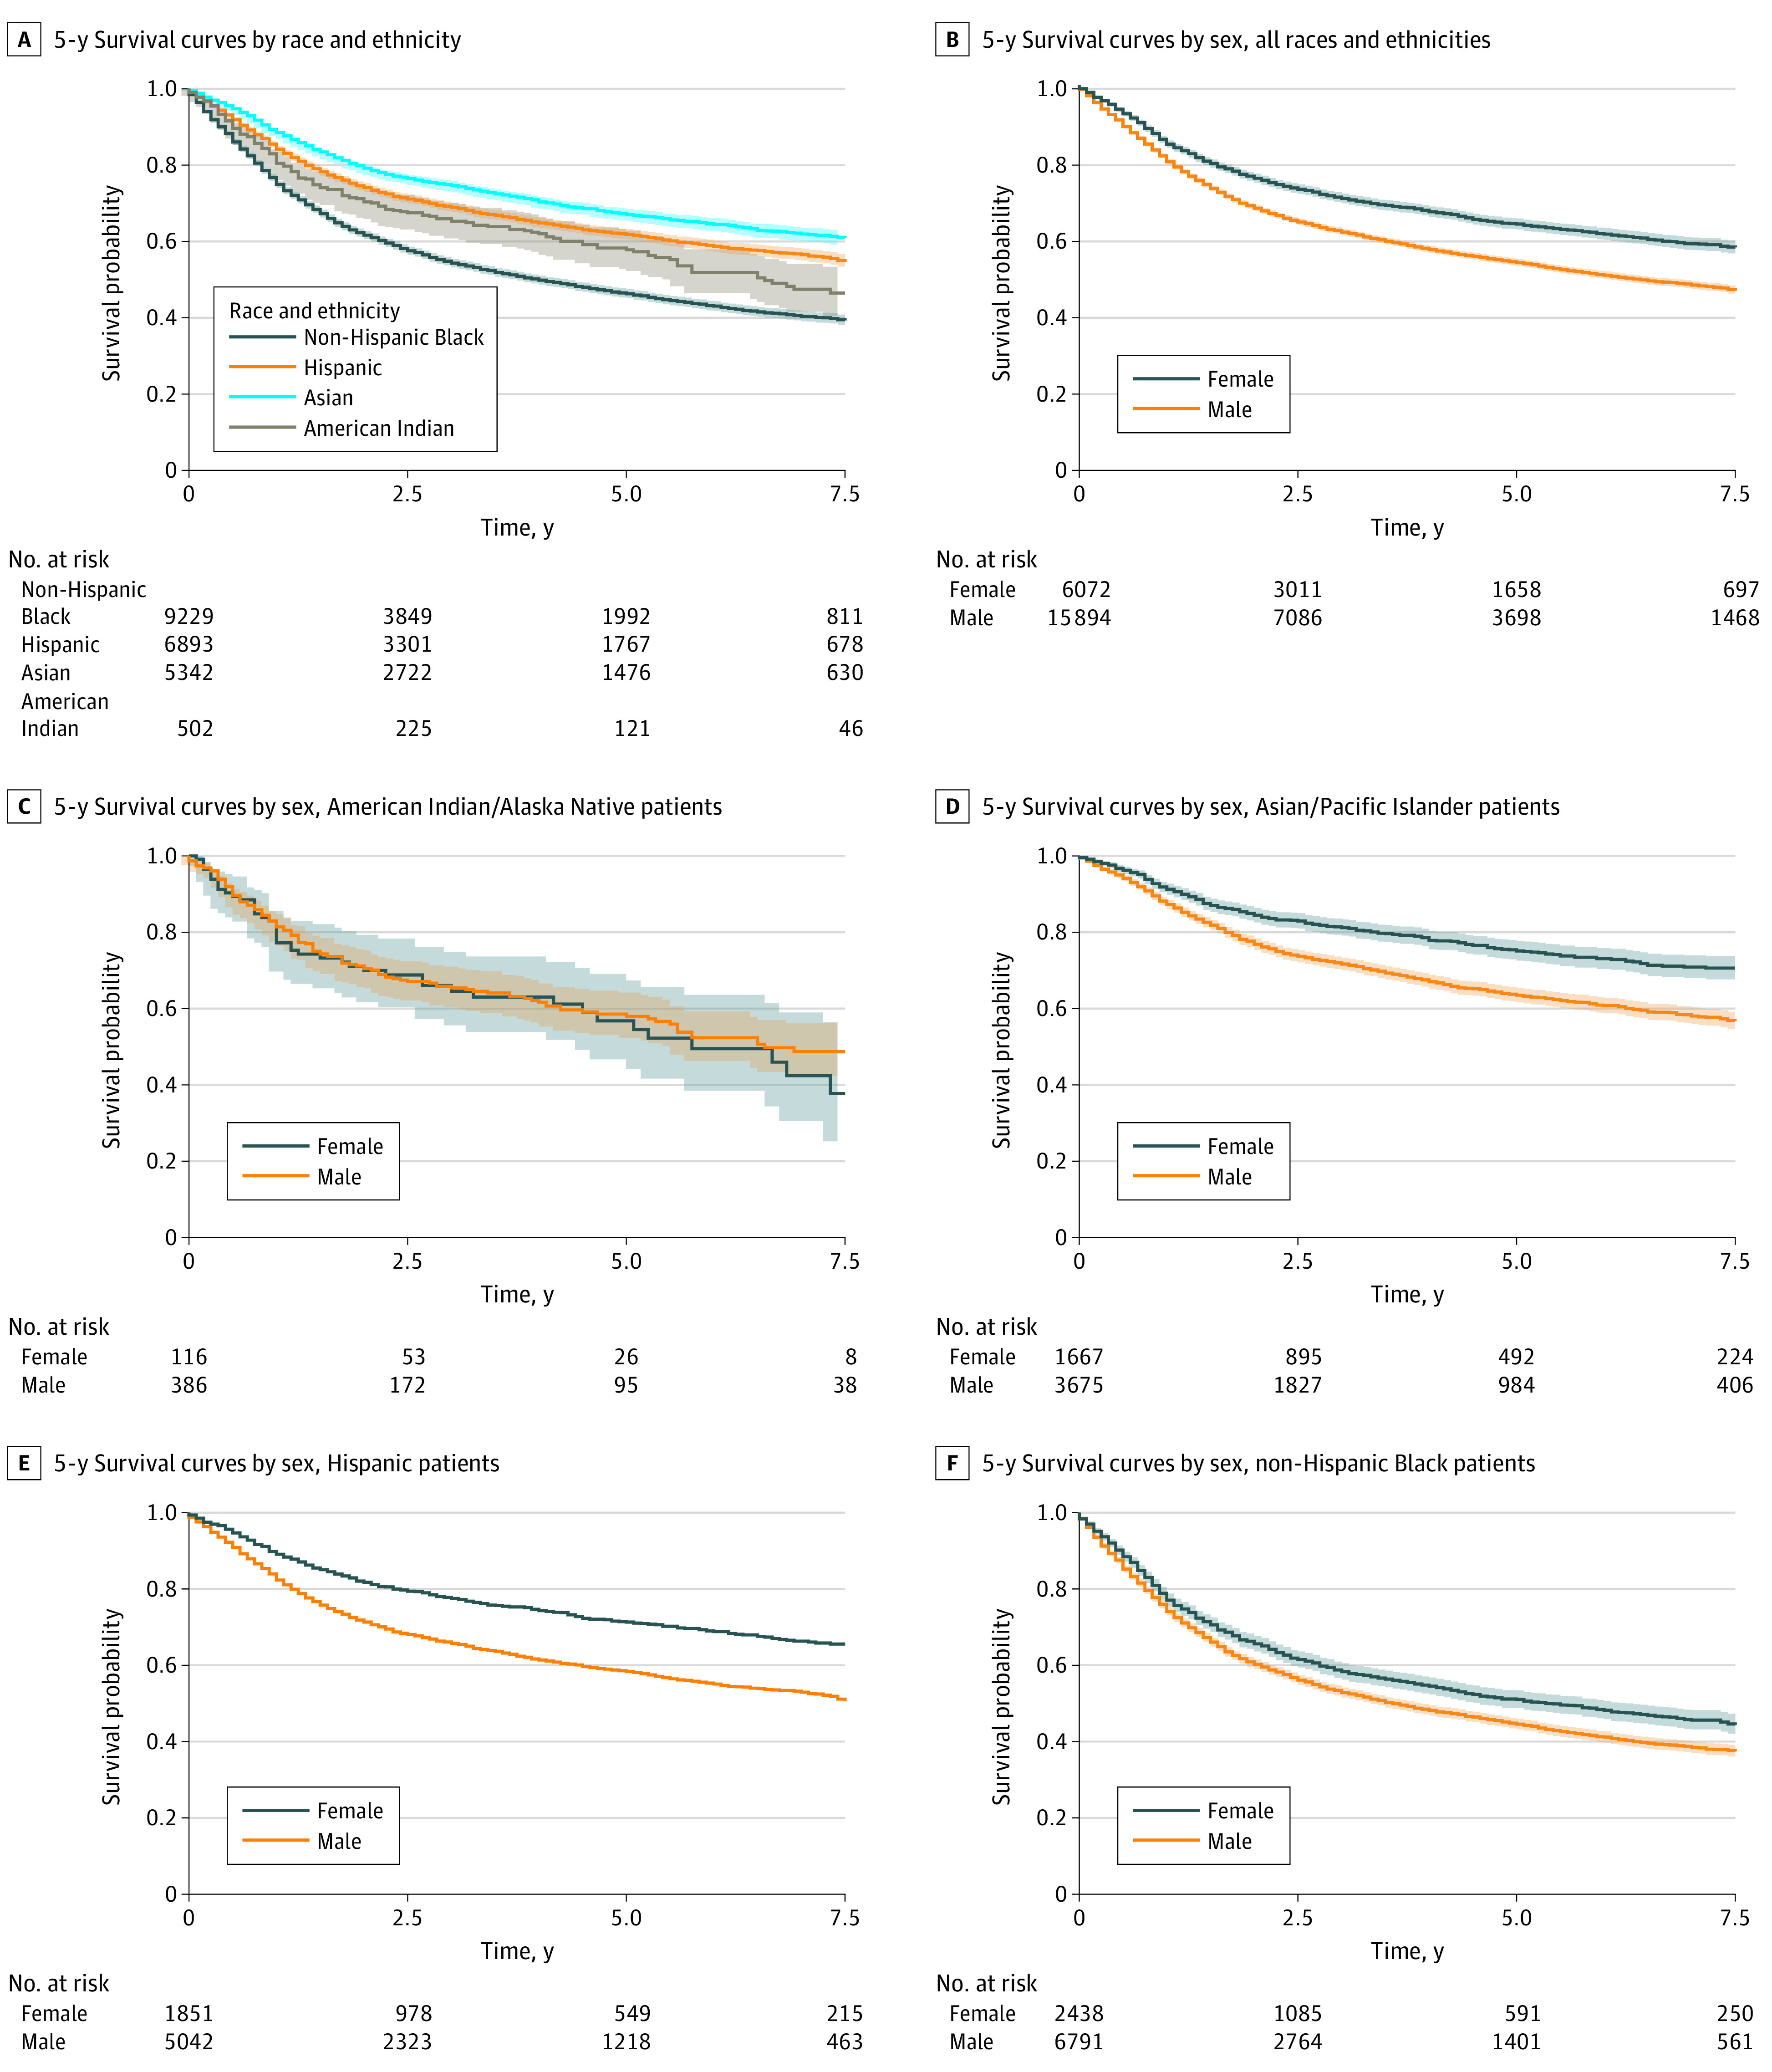
Figure 1. Five-Year Survival Curves in Patients With Head and Neck Cancer by Race and Ethnicity and by Sex.

Five-year survival curves in patients with head and neck cancer by race and ethnicity (A), for all race and ethnicity minority groups combined (B), and for each race and ethnicity minority group separately (C-F). Censoring not shown.
