
Figure 1.
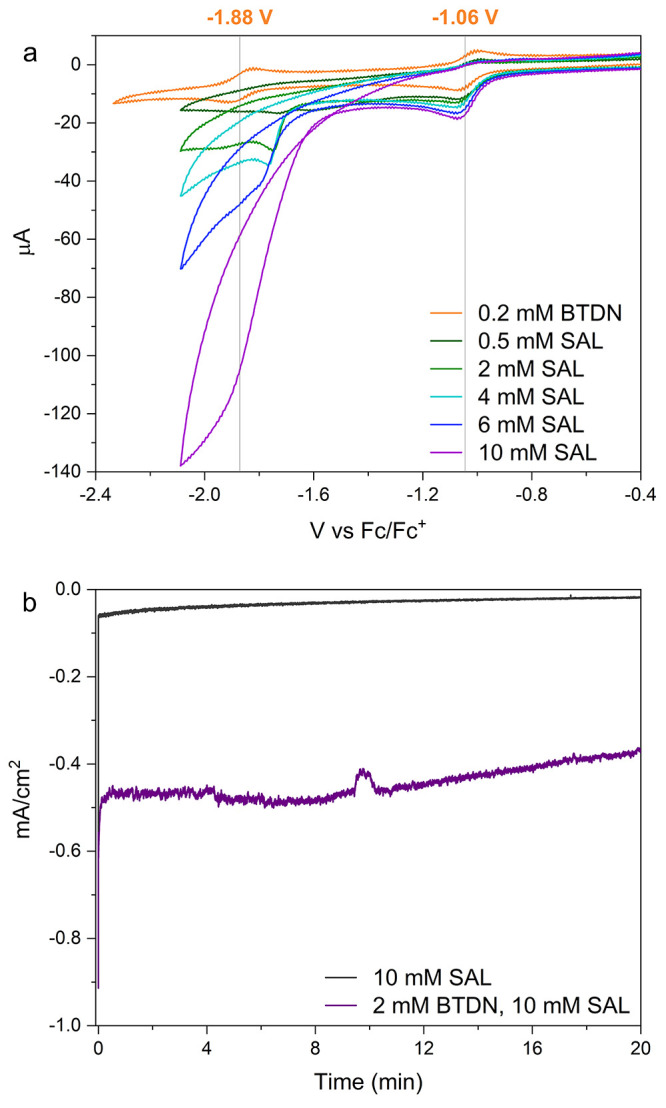
(a) Cyclic voltammetry of BTDN combined with titration of SAL, going from two reversible redox waves for only BTDN (orange) to the fully catalytic behavior with 50 equiv. of SAL (purple). (b) Current from electrocatalytic H2 generation at −1.65 V vs Fc/Fc+ from 10 mM SAL (black) and 2 mM BTDN with 10 mM SAL (purple).