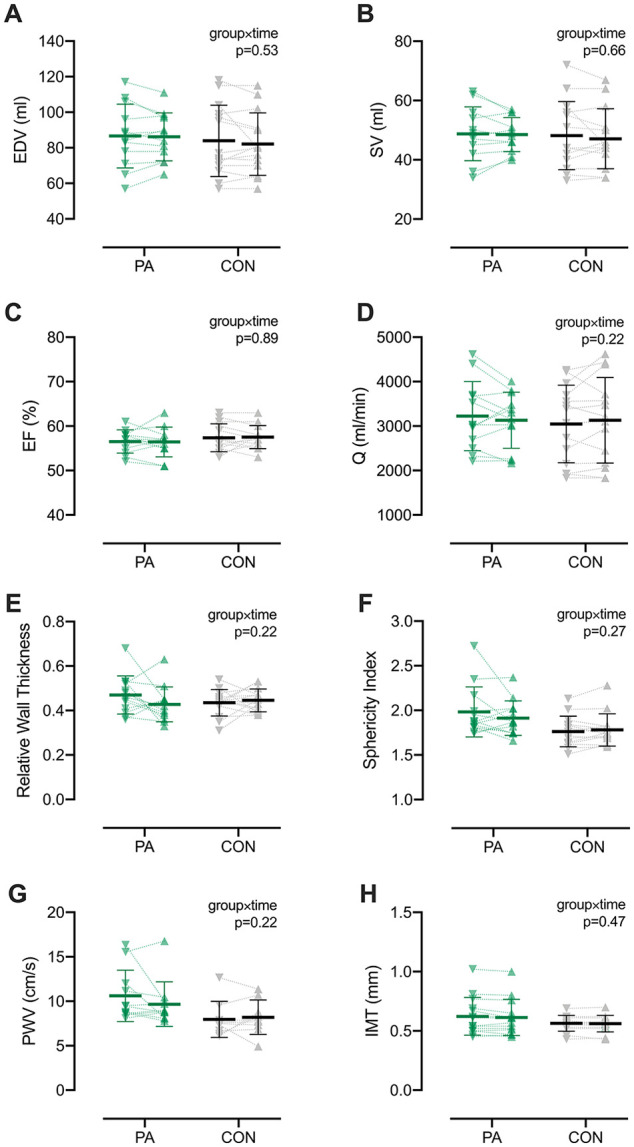
Figure 1.

Resting cardiac and vascular measures at baseline (∇) and following the 8-week intervention period (∆). Bars represent means ± SD. Individual data are shown for participants in the physical activity (PA; green symbols) and control (CON; gray symbols). There were no main or interaction effects observed for echocardiographic measures of left ventricular end-diastolic volume (EDV; A), stroke volume (SV; B), ejection fraction (EF; C), cardiac output (Q; D), relative wall thickness (E), or sphericity index (F), despite significant improvements in cardiorespiratory fitness for the PA group (Supplemental Table 2). Likewise, vascular measures of pulse-wave velocity (PWV, G) and intima media thickness (IMT; H) were unchanged following the 8-week intervention period. n = 13 for both PA and CON. Additional cardiac and vascular data and statistics are found in Supplemental Tables 3 and 4.
