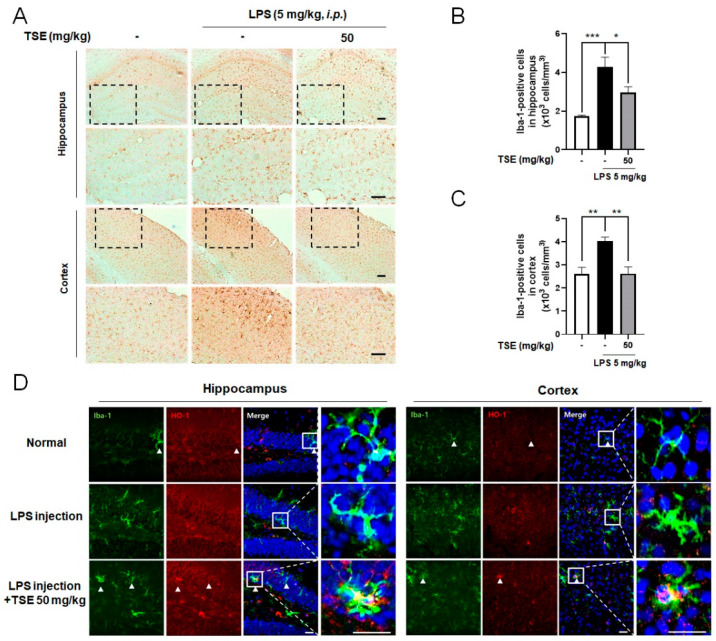
Figure 6.
Effects of TSE on LPS-induced microglial activation in hippocampus and cortex. Mice were treated with TSE (50 mg/kg, p.o.) for 5 days, and injected with LPS (5 mg/kg, i.p.) on the fifth day. Representative images stained with DAB, and quantifications for the Iba-1+ cells in the hippocampus and cortex are shown (n = 5 per group) (A–C). The images of double immunofluorescence staining with anti-Iba-1 and anti-HO-1 in the hippocampus and cortex are shown (D). Scale bar = 100 μm. Data were analyzed by one-way ANOVA, followed by Dunnett’s post hoc test. * p < 0.05, ** p < 0.01, and *** p < 0.001.

