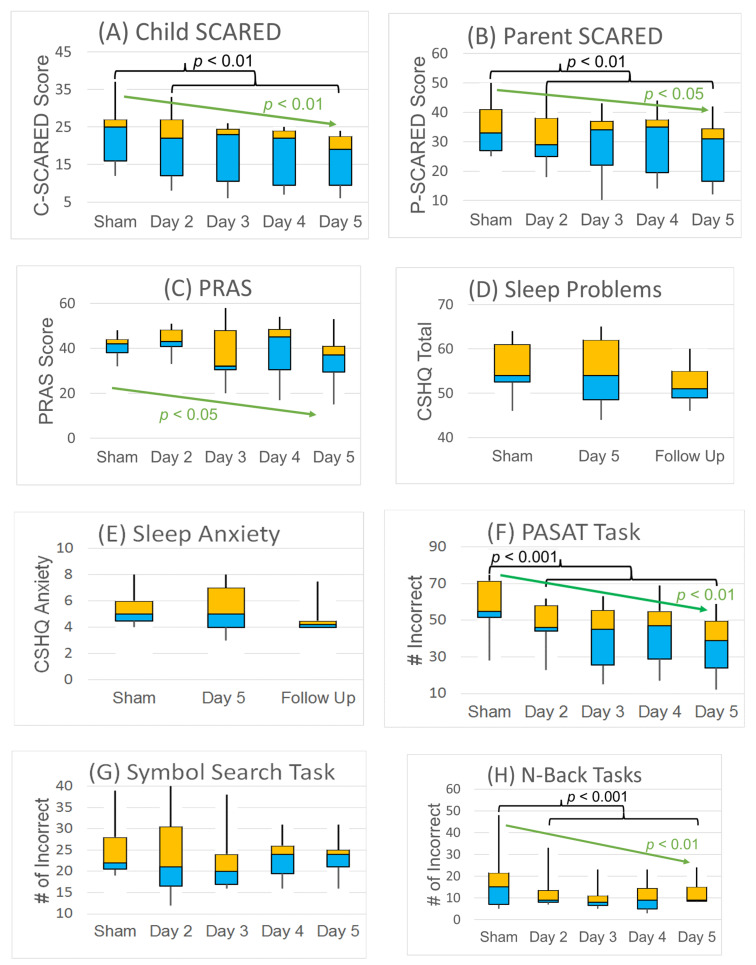
Figure 4.
Effects of TEN treatment on (A–C) anxiety, (D,E) sleep and (F–H) cognitive performance (n = 7). Median, quartiles and min and max are shown. Black brackets represent significant differences between the sham day and TEN days (days 2–5). Green arrows represent significant trends in outcome with more treatment days.

