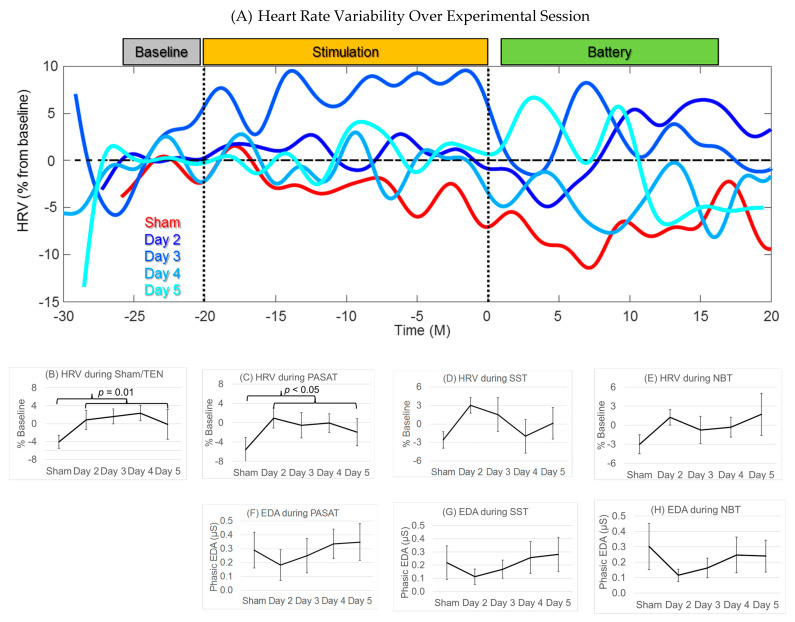
Figure 6.
The effect of TEN on HRV and EDA. Mean and standard error bars are shown. The increase in HRV is shown for (A) an example individual, (B) across the group for the time period of the sham/TEN and (C–E) and for the anxiety-provoking tasks. HRV was significantly higher (improved) during TEN sessions as compared to the sham during the (B) stimulation and (C) the PASAT (shown as black brackets). EDA during (F–H) anxiety-provoking tasks decreased after the sham, but did not reach significance at the group level. No EDA was computed during the sham/TEN.

