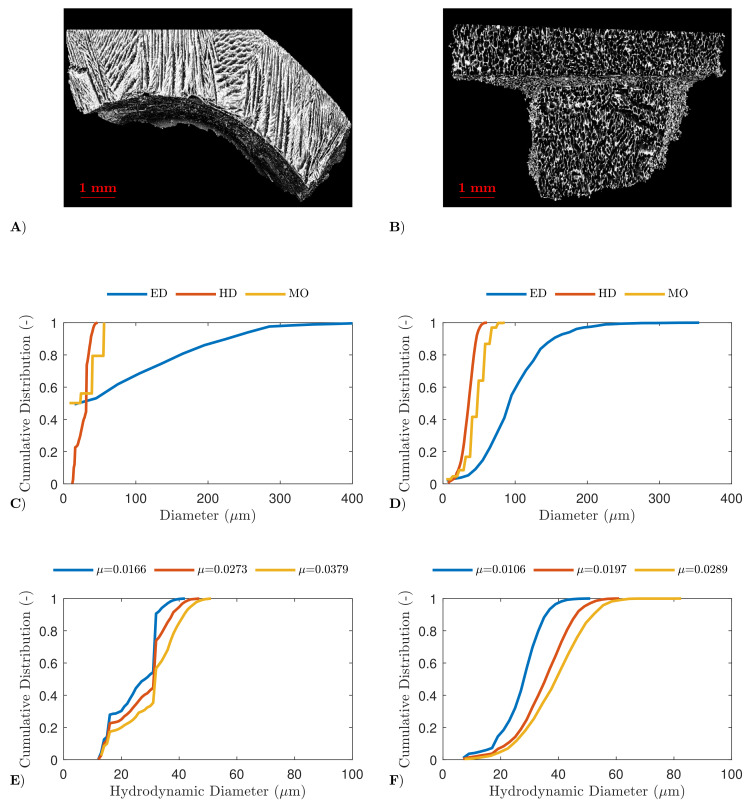
Figure 2.
µCT results of the mannitol formulation. Reconstructed 3D image of the dried product layer obtained via a high (panel A) and slow spin-freezing rate (panel B). The cumulative distribution of the equivalent diameter (ED), hydrodynamic diameter (HD) and maximum opening (MO) of the dried product layer obtained via a high (panel C) and slow spin-freezing rate (panel D). The cumulative distribution of the hydrodynamic diameter of the dried product layer obtained via a high (panel E) and slow spin-freezing rate in function of used threshold (panel F).

