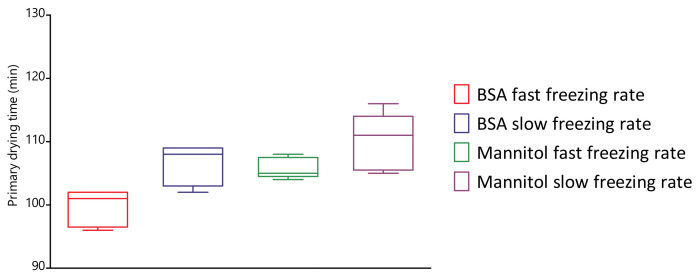
Figure 8.
Boxplot of the primary drying time determined via thermal imaging (whiskers indicate the 10–90 percentile). A total increase in primary drying time of 7 and 5% for the BSA and mannitol formulation, respectively, was observed via thermal imaging when a slower spin-freezing rate was used (statistically different from each other, p-value = 0.0010, at = 95%).

