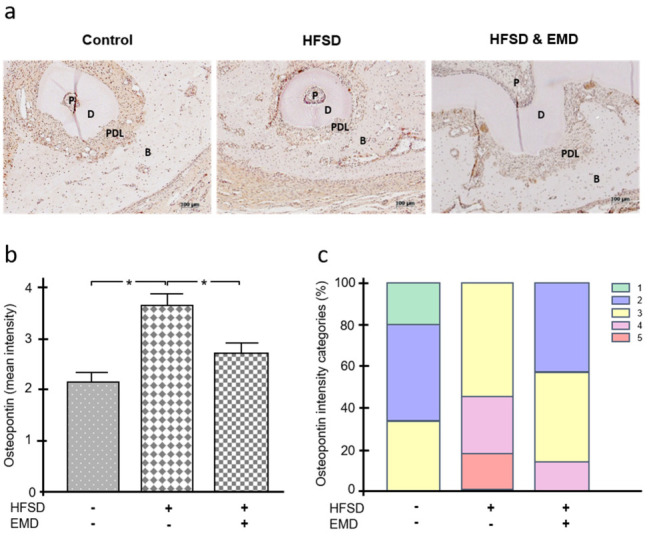
Figure 4.

Effect of obesity on osteopontin in the presence and absence of EMD. (a) Osteopontin protein in normal-weight control animals, HFSD-fed animals, and HFSD-fed and EMD-treated animals. Representative immunohistochemistry images are shown. (b) Mean intensity of osteopontin in normal-weight control animals, HFSD-fed animals, and HFSD-fed and EMD-treated animals. Bars show mean ± SEM; n = 5 animals/group; * significant (p < 0.05) difference between groups. (c) Frequency distribution of different intensity categories for osteopontin in normal-weight control animals, HFSD-fed animals, and HFSD-fed and EMD-treated animals. The intensity of immunohistochemical staining was assigned to five intensity categories (1 = very low, 2 = low, 3 = moderate, 4 = high, 5 = very high). EMD (enamel matrix derivative), HFSD (high fat, high sucrose diet), P (pulp), D (dentin), PDL (periodontal ligament), B (bone).
